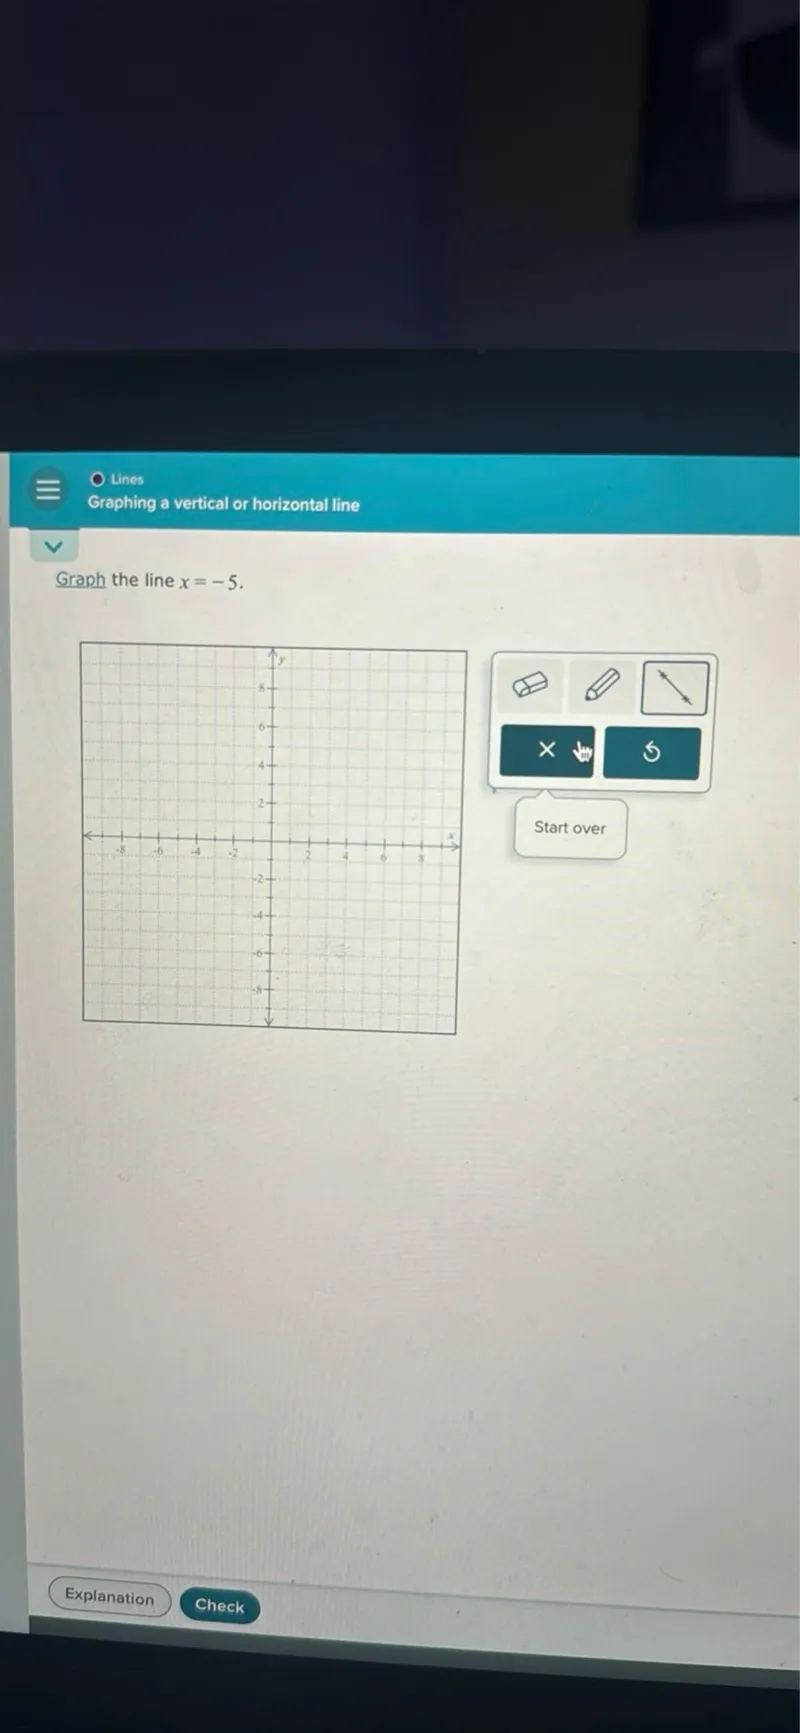
The equation \(x = -5\) represents a vertical line. This means that for every value of \(y\), the value of \(x\) is always -5.
Step 2: Locate points on the line
Since \(x\) is always -5, we can choose any two points with an x-coordinate of -5. For example, \((-5, 0)\) and \((-5, 2)\).
Step 3: Plot the points
Plot the points \((-5, 0)\) and \((-5, 2)\) on the graph.
Step 4: Draw the line
Draw a straight vertical line passing through the plotted points. This line represents all points where \(x = -5\).
Final Answer
The graph of the line \(x = -5\) is a vertical line passing through \((-5, 0)\), \((-5, 2)\) and all other points with an x-coordinate of -5. It is parallel to the y-axis and is located 5 units to the left of it. \(\boxed{x = -5}\)