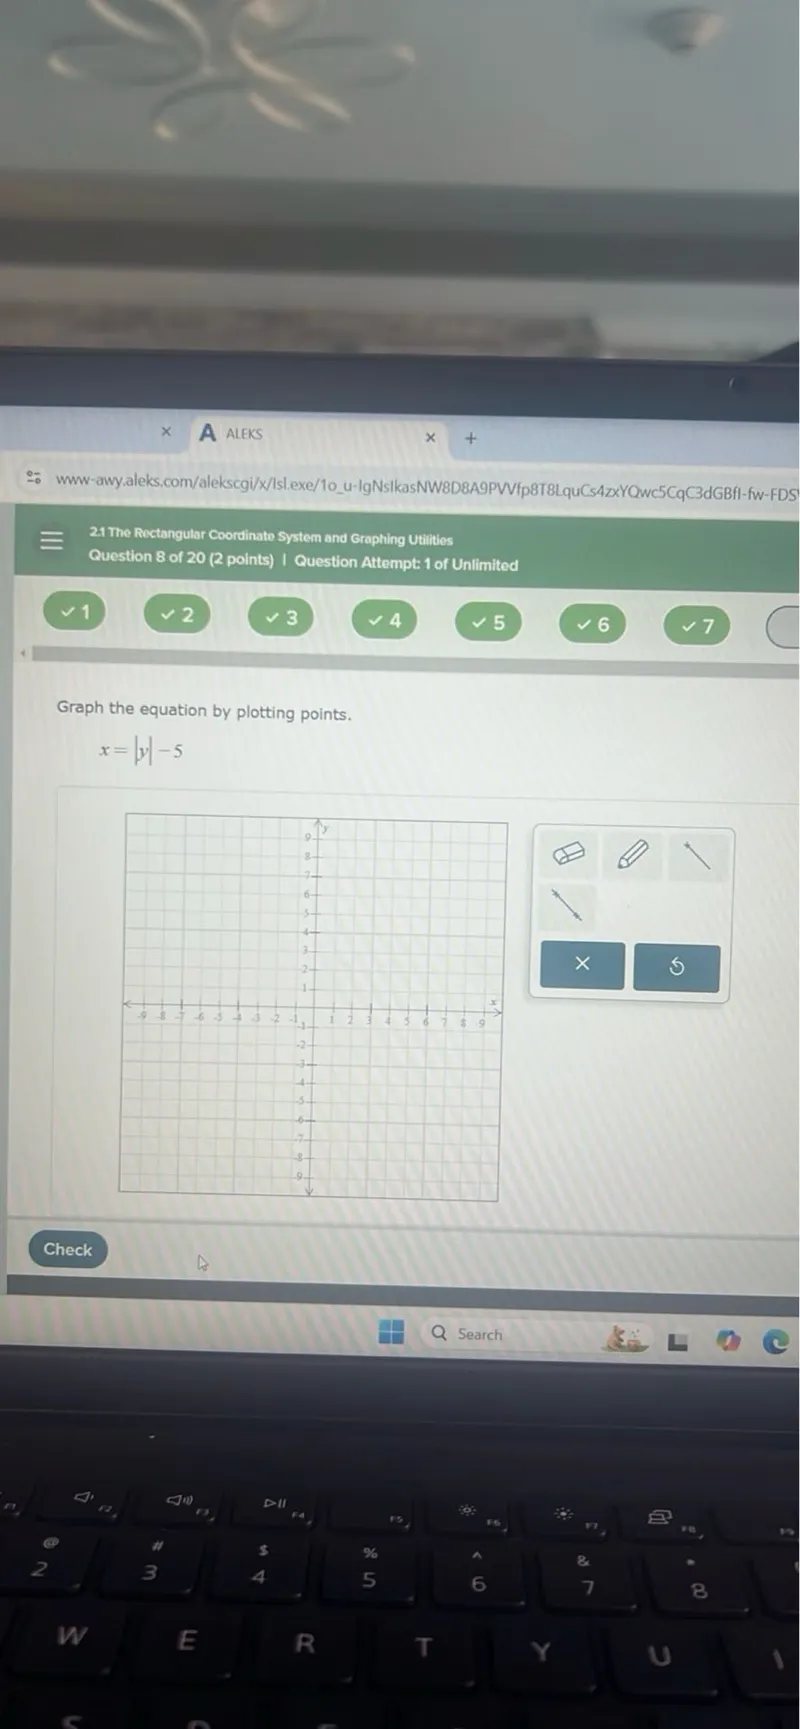
Graph the equation by plotting points.
\(x=|y|-5\)
Choose values for \(y\)
Let's choose some values for \(y\) and find the corresponding \(x\) values.
Calculate \(x\) when \(y=-3\)
\(x = |-3| - 5 = 3 - 5 = -2\)
Calculate \(x\) when \(y=-2\)
\(x = |-2| - 5 = 2 - 5 = -3\)
Calculate \(x\) when \(y=-1\)
\(x = |-1| - 5 = 1 - 5 = -4\)
Calculate \(x\) when \(y=0\)
\(x = |0| - 5 = 0 - 5 = -5\)
Calculate \(x\) when \(y=1\)
\(x = |1| - 5 = 1 - 5 = -4\)
Calculate \(x\) when \(y=2\)
\(x = |2| - 5 = 2 - 5 = -3\)
Calculate \(x\) when \(y=3\)
\(x = |3| - 5 = 3 - 5 = -2\)
Plot the points
We have the following points: \((-2, -3)\), \((-3, -2)\), \((-4, -1)\), \((-5, 0)\), \((-4, 1)\), \((-3, 2)\), \((-2, 3)\). Plotting these points on the graph and connecting them reveals a V-shaped graph opening to the right with the vertex at \((-5, 0)\).
\(\boxed{\text{See the graph below}}\)
[asy]
size(200);
import graph;
real ticklen=3;
real tickspace=2;
real ticklength=0.1cm;
real axisarrowsize=0.14cm;
pen axispen=black+1.3bp;
real vectorarrowsize=0.2cm;
real tickdown=-0.5;
real tickdownlength=-0.15inch;
real tickdownbase=0.3;
real wholetickdown=tickdown;
void rr_cartesian_axes(real xlow, real xhigh, real ylow, real yhigh, bool useticks=false, bool complexplane=false, bool usegrid=true) {
import graph;
real i;
if(complexplane) {
label("$\textnormal{Re}$",(xhigh,0),SE);
label("$\textnormal{Im}$",(0,yhigh),NW);
} else {
label("$x$",(xhigh,0),SE);
label("$y$",(0,yhigh),NW);
}
ylimits(ylow,yhigh);
xlimits( xlow, xhigh);
xaxis(BottomTop(extend=false), Ticks("%", Ticks::PATH(),pTick=extend(0.1,0.1),extend=true),p=invisible);//,above=true);
yaxis(LeftRight(extend=false),Ticks("%", Ticks::PATH(),pTick=extend(0.1,0.1),extend=true), p=invisible);//,Arrows);
if(usegrid) {
xaxis(BottomTop(extend=false), grid(withcolor=gray(0.8)),Arrows);
yaxis(LeftRight(extend=false), grid(withcolor=gray(0.8)),Arrows);
}
}
rr_cartesian_axes(-9,9,-9,9);
draw((-5,0)--(-4,1)--(-3,2)--(-2,3),red);
draw((-5,0)--(-4,-1)--(-3,-2)--(-2,-3),red);
dot((-5,0));
dot((-4,1));
dot((-3,2));
dot((-2,3));
dot((-4,-1));
dot((-3,-2));
dot((-2,-3));
[/asy]
The graph of \(x=|y|-5\) is a V-shaped graph opening to the right with the vertex at \((-5, 0)\).