Questions: Using the graph below, determine the profit-maximizing price and quantity to produce. Profit-maximizing price = 10 Quantity to produce = 20 units

Using the graph below, determine the profit-maximizing price and quantity to produce. Profit-maximizing price = 10 Quantity to produce = 20 units
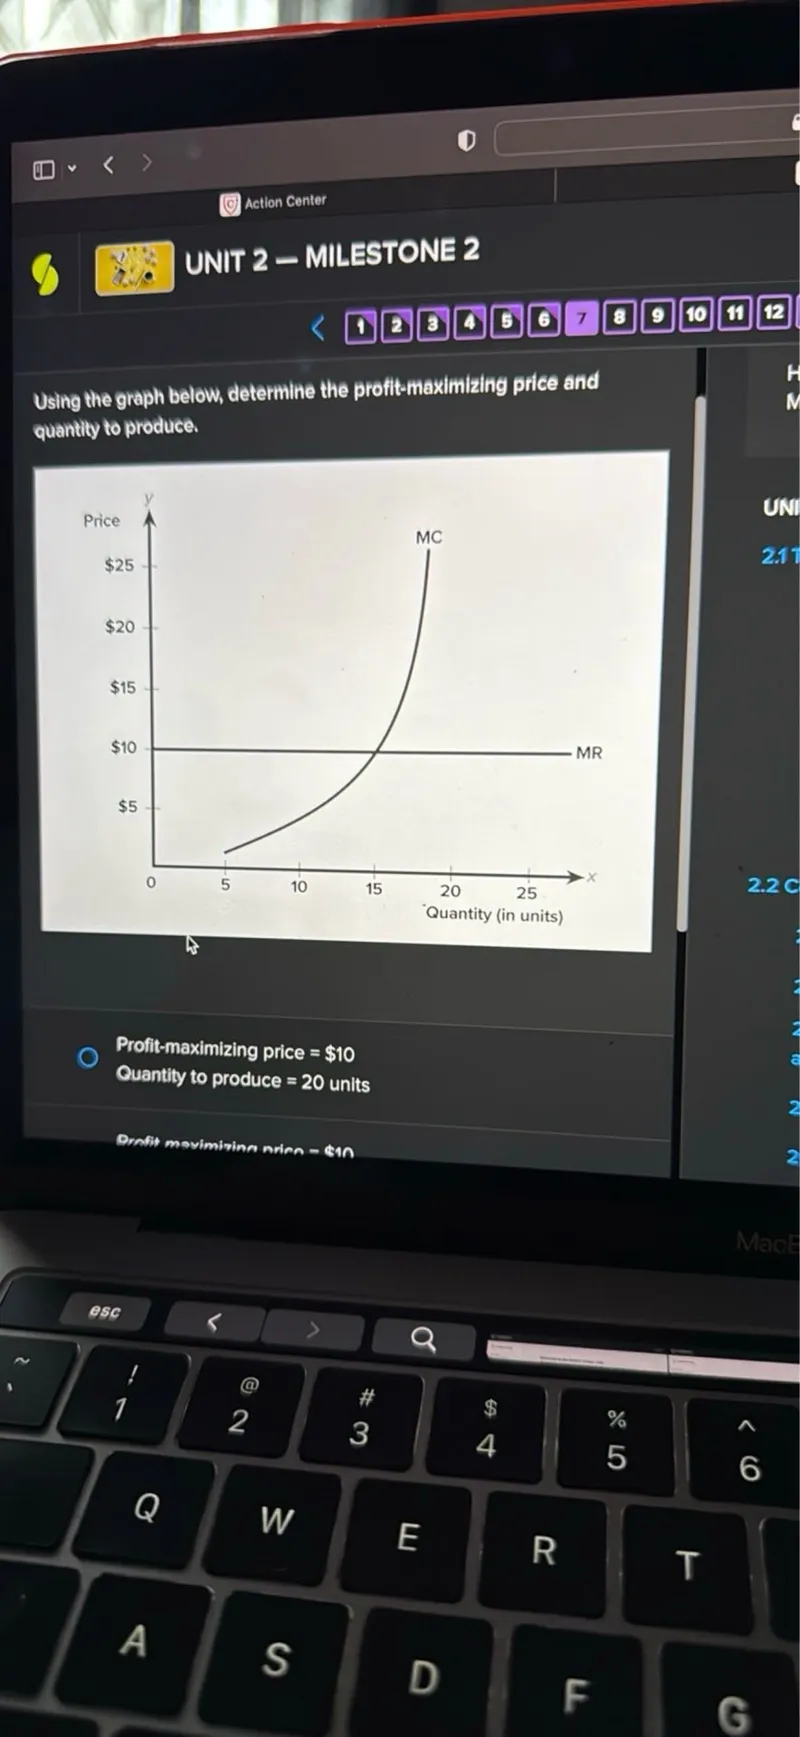
Transcript text: Using the graph below, determine the profit-maximizing price and quantity to produce. Profit-maximizing price $=\$ 10$ Quantity to produce $=20$ units
failed

Solution

failed
failed

Solution Steps

Step 1: Find the intersection of MR and MC

The profit-maximizing quantity is where Marginal Revenue (MR) equals Marginal Cost (MC). In the given graph, the MR curve is a horizontal line at $10, and the MC curve is an upward-sloping curve. The intersection point of these two curves determines the profit-maximizing quantity. Visually, this intersection occurs at a quantity of 16 units.

Step 2: Determine the profit-maximizing price

Once the profit-maximizing quantity is determined, the corresponding price can be found on the demand curve (which is not explicitly shown in this graph, but is implicit since MR is constant and equal to $10. A constant MR implies the firm is a price taker, facing a perfectly elastic demand curve). Since the market price is given by the horizontal MR curve, the profit-maximizing price is $10.

Final Answer

Profit-maximizing price = \\(\boxed{\$10}\\) Profit-maximizing quantity = \\(\boxed{16 \text{ units}}\\)

Was this solution helpful?
failed
Unhelpful
failed
Helpful