Questions: State Gasoline Taxes A random sample of state gasoline taxes (in cents) is shown here for 8 states. Round sample statistics and final answers to at least two decimal places. 32.1, 33.3, 50, 43, 44.9, 33.7, 62.8, 49.8 Use the data to estimate the true population mean gasoline tax with 80% confidence. Assume the variable is normally distributed. <μ<

State Gasoline Taxes A random sample of state gasoline taxes (in cents) is shown here for 8 states. Round sample statistics and final answers to at least two decimal places. 32.1, 33.3, 50, 43, 44.9, 33.7, 62.8, 49.8 Use the data to estimate the true population mean gasoline tax with 80% confidence. Assume the variable is normally distributed. <μ<
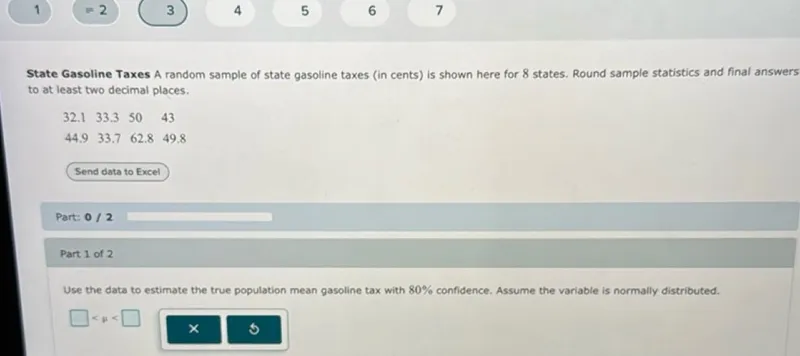
Transcript text: State Gasoline Taxes A random sample of state gasoline taxes (in cents) is shown here for 8 states. Round sample statistics and final answers to at least two decimal places. $\begin{array}{llll}32.1 & 33.3 & 50 & 43\end{array}$ $\begin{array}{llll}44.9 & 33.7 & 62.8 & 49.8\end{array}$ Use the data to estimate the true population mean gasoline tax with $80 \%$ confidence. Assume the variable is normally distributed. $\square$ $<\mu<$ $\square$
failed

Solution

failed
failed

Solution Steps

Step 1: Calculate the Mean

The mean gasoline tax is calculated using the formula: \[ \mu = \frac{\sum_{i=1}^N x_i}{N} = \frac{349.6}{8} = 43.7 \]

Step 2: Calculate the Variance and Standard Deviation

The variance is calculated using the formula: \[ \sigma^2 = \frac{\sum (x_i - \mu)^2}{n-1} = 112.34 \] The standard deviation is then obtained by taking the square root of the variance: \[ \sigma = \sqrt{112.34} = 10.6 \]

Step 3: Determine the Z-Score for 80% Confidence

For an 80% confidence level, the Z-score is approximately: \[ Z = 1.28 \]

Step 4: Calculate the Margin of Error

The margin of error is calculated using the formula: \[ \text{Margin of Error} = \frac{Z \times \sigma}{\sqrt{n}} = \frac{1.28 \times 10.6}{\sqrt{8}} = 4.8 \]

Step 5: Construct the Confidence Interval

The 80% confidence interval for the true population mean is given by: \[ \text{Confidence Interval: } \left( \mu - \text{Margin of Error}, \mu + \text{Margin of Error} \right) = \left( 43.7 - 4.8, 43.7 + 4.8 \right) = (38.9, 48.5) \]

Final Answer

\(\boxed{38.9 < \mu < 48.5}\)

Was this solution helpful?
failed
Unhelpful
failed
Helpful