Questions: Lengths of a random sample of 15 rivers on the South Island of New Zealand that flow to the Tasman Sea (km or kilometers) are listed in the table below. Length 40 76 56 72 68 177 64 56 32 64 80 35 32 56 80 For the data shown above, find the following. Round answer in the first blank to 1 decimal place(s). In the second blank put the correct units. Find the mean: Find the median: Find the range: Find the standard deviation:
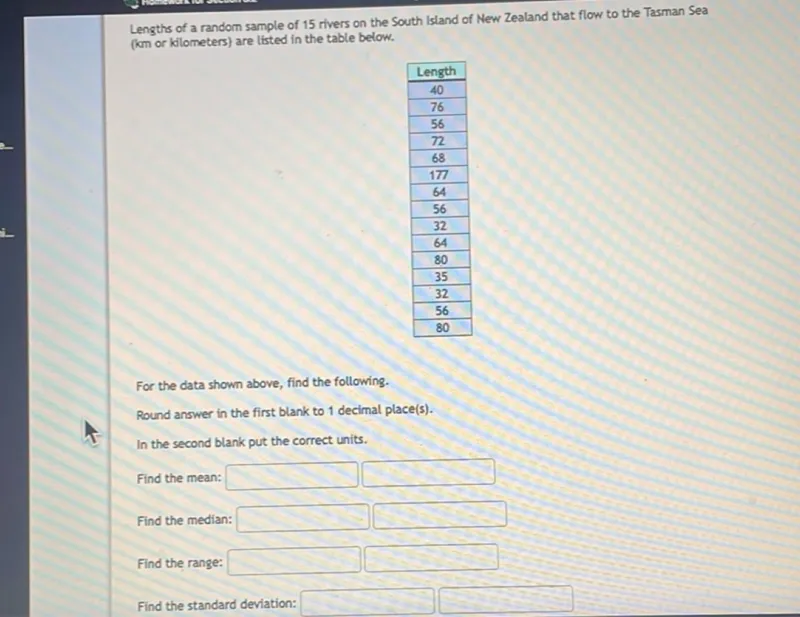
Transcript text: Lengths of a random sample of 15 rivers on the South Island of New Zealand that flow to the Tasman Sea (km or kilometers) are listed in the table below.
\begin{tabular}{|c|}
\hline Length \\
\hline 40 \\
\hline 76 \\
\hline 56 \\
\hline 72 \\
\hline 68 \\
\hline 177 \\
\hline 64 \\
\hline 56 \\
\hline 32 \\
\hline 64 \\
\hline 80 \\
\hline 35 \\
\hline 32 \\
\hline 56 \\
\hline 80 \\
\hline
\end{tabular}
For the data shown above, find the following.
Round answer in the first blank to 1 decimal place(s).
In the second blank put the correct units.
Find the mean: $\square$
$\square$
Find the median: $\square$
$\square$
Find the range: $\square$
$\square$
Find the standard deviation: $\square$
$\square$
Solution
Was this solution helpful?


