Questions: Use the intercepts to sketch the graph of the function: y=x-5
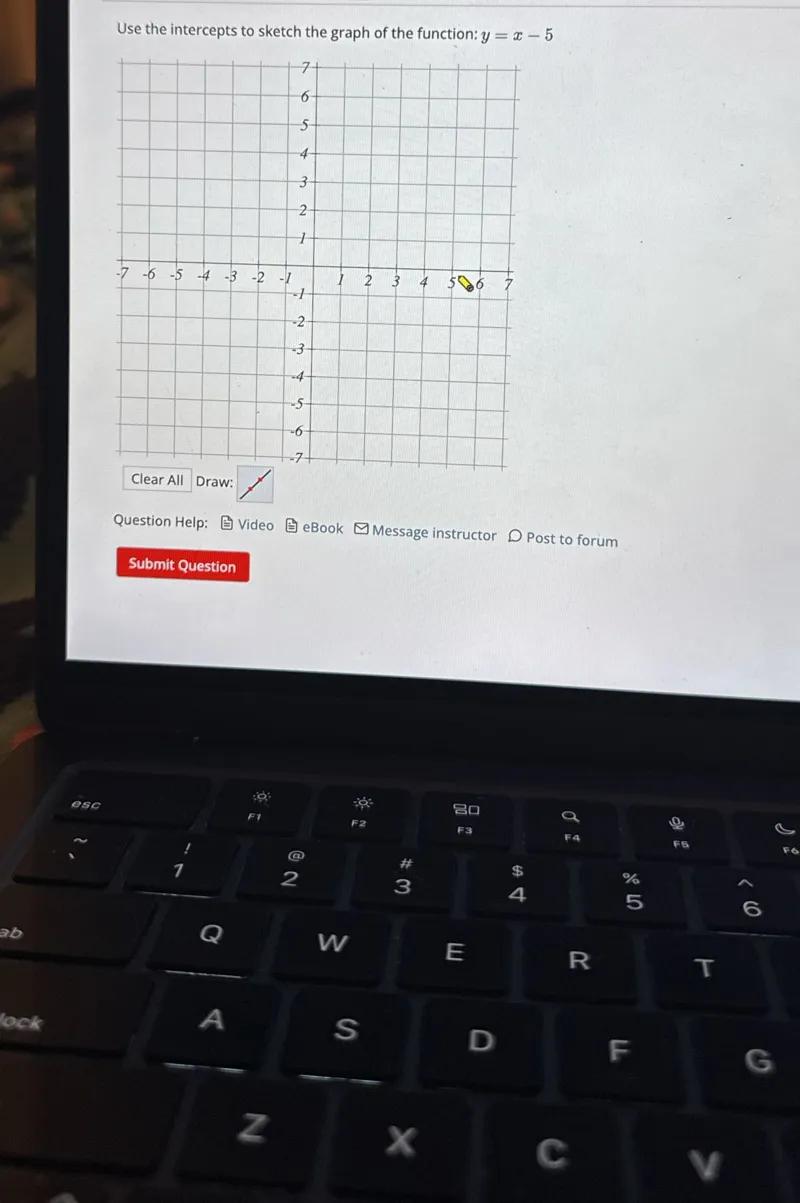
Transcript text: Use the intercepts to sketch the graph of the function: $y=x-5$
Solution
Solution Steps
Step 1: Find the x-intercept
To find the x-intercept, we set \(y = 0\) and solve for \(x\):
\(0 = x - 5\)
\(x = 5\)
So the x-intercept is \((5, 0)\).
Step 2: Find the y-intercept
To find the y-intercept, we set \(x = 0\) and solve for \(y\):
\(y = 0 - 5\)
\(y = -5\)
So the y-intercept is \((0, -5)\).
Step 3: Plot the intercepts and draw the line
We plot the points \((5, 0)\) and \((0, -5)\) on the Cartesian plane. Since we know that the graph of \(y = x - 5\) is a line, we can simply draw a straight line passing through these two points.
Final Answer
The graph of the function \(y = x - 5\) is a line passing through the points \((5, 0)\) and \((0, -5)\). The given image shows a point at \((5,0)\) which matches the x-intercept, thus the equation is consistent with the plotted point.