Questions: Graph the solution set. 3x - 5y > 15

Graph the solution set.
3x - 5y > 15
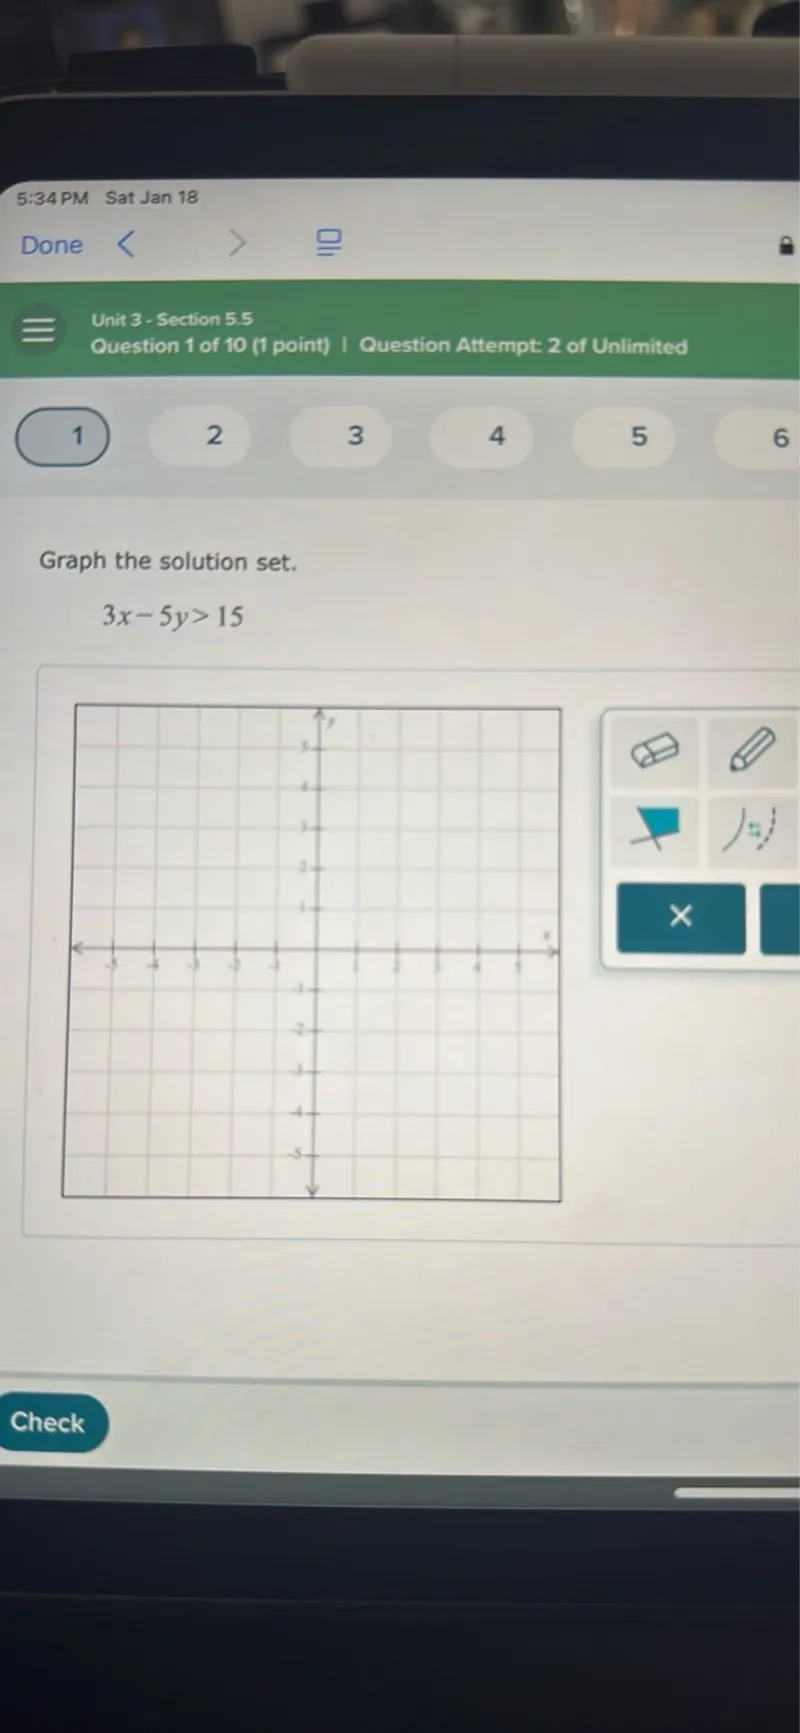
Transcript text: Graph the solution set. \[ 3 x-5 y>15 \]
failed

Solution

failed
failed

Solution Steps

Step 1: Rewrite the inequality as an equation

To graph the solution set of the inequality \(3x - 5y > 15\), we first rewrite the inequality as an equation: \[3x - 5y = 15\]

Step 2: Find the x and y intercepts

To find the x-intercept, set \(y = 0\) and solve for \(x\): \[3x - 5(0) = 15\] \[3x = 15\] \[x = 5\] So the x-intercept is \((5, 0)\).

To find the y-intercept, set \(x = 0\) and solve for \(y\): \[3(0) - 5y = 15\] \[-5y = 15\] \[y = -3\] So the y-intercept is \((0, -3)\).

Step 3: Graph the line

Plot the x-intercept \((5,0)\) and the y-intercept \((0,-3)\) on the coordinate plane. Draw a dashed line through these points, since the inequality is strictly greater than (\(>\)) and not greater than or equal to (\(\geq\)).

Step 4: Choose a test point

Choose a test point not on the line, such as the origin \((0,0)\). Substitute the coordinates of the test point into the original inequality: \[3(0) - 5(0) > 15\] \[0 > 15\] This is false.

Step 5: Shade the solution region

Since the test point \((0,0)\) does not satisfy the inequality, shade the region that does not contain the origin. This is the region below the dashed line.

Final Answer

The graph of the solution set is the region below the dashed line passing through the points (5,0) and (0,-3).

Was this solution helpful?
failed
Unhelpful
failed
Helpful