Questions: The speed (in mph ) of randomly selected bicyclists were measured as they were approaching a hill. The results are presented in the following histogram. How many of those bicyclists were traveling at least 8.5 and less than 11.5 mph as they were approaching the hill?

The speed (in mph ) of randomly selected bicyclists were measured as they were approaching a hill. The results are presented in the following histogram.
How many of those bicyclists were traveling at least 8.5 and less than 11.5 mph as they were approaching the hill?
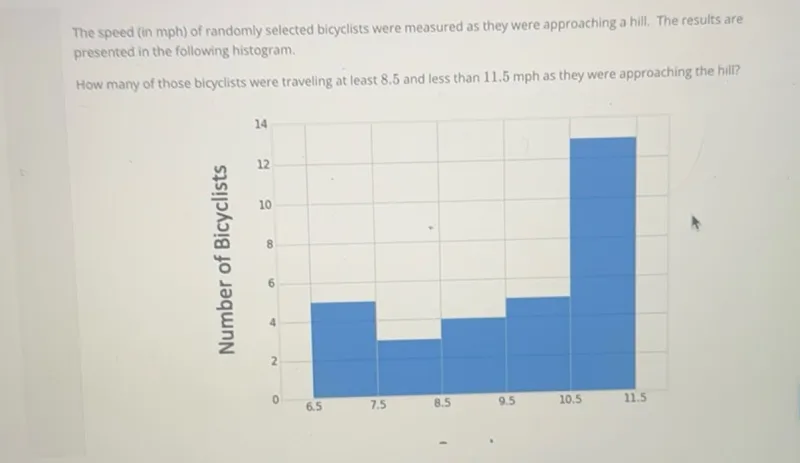
Transcript text: The speed (in mph ) of randomly selected bicyclists were measured as they were approaching a hill. The results are presented in the following histogram. How many of those bicyclists were traveling at least 8.5 and less than 11.5 mph as they were approaching the hill?
failed

Solution

failed
failed

Solution Steps

Step 1: Identify the relevant bars

The question asks for the number of bicyclists traveling at least 8.5 mph and less than 11.5 mph. This corresponds to the bars representing the intervals 8.5-9.5, 9.5-10.5, and 10.5-11.5.

Step 2: Count the number of bicyclists in each bar

The bar for 8.5-9.5 represents 4 bicyclists. The bar for 9.5-10.5 represents 5 bicyclists. The bar for 10.5-11.5 represents 13 bicyclists.

Step 3: Sum the counts

The total number of bicyclists traveling at least 8.5 mph and less than 11.5 mph is the sum of the counts from the three bars: 4 + 5 + 13 = 22.

Final Answer

\( \boxed{22} \) bicyclists were traveling at least 8.5 mph and less than 11.5 mph.

Was this solution helpful?
failed
Unhelpful
failed
Helpful