Questions: The table below shows the fraction of games won (to the nearest thousandth) by six professional teams in the east coast and west coast leagues for the 2016 season. The lists include the teams with the best and worst win-loss records in both leagues. Complete parts (a) through (e) below. East coast teams 0.429 0.466 0.484 0.522 0.584 0.637 West coast teams 0.361 0.414 0.500 0.543 0.582 0.586 The standard deviation for the west coast teams is 0.093. d. Apply the range rule of thumb to estimate the standard deviation of each of the data sets. How well does the rule work in each case? Briefly discuss why it does or does not work well. Using the range rule of thumb the standard deviation for the east coast teams is approximately 0.052. Using the range rule of thumb the standard deviation for the west coast teams is approximately

The table below shows the fraction of games won (to the nearest thousandth) by six professional teams in the east coast and west coast leagues for the 2016 season. The lists include the teams with the best and worst win-loss records in both leagues. Complete parts (a) through (e) below.
East coast teams 0.429 0.466 0.484 0.522 0.584 0.637
West coast teams 0.361 0.414 0.500 0.543 0.582 0.586
The standard deviation for the west coast teams is 0.093.
d. Apply the range rule of thumb to estimate the standard deviation of each of the data sets. How well does the rule work in each case? Briefly discuss why it does or does not work well.

Using the range rule of thumb the standard deviation for the east coast teams is approximately 0.052.
Using the range rule of thumb the standard deviation for the west coast teams is approximately
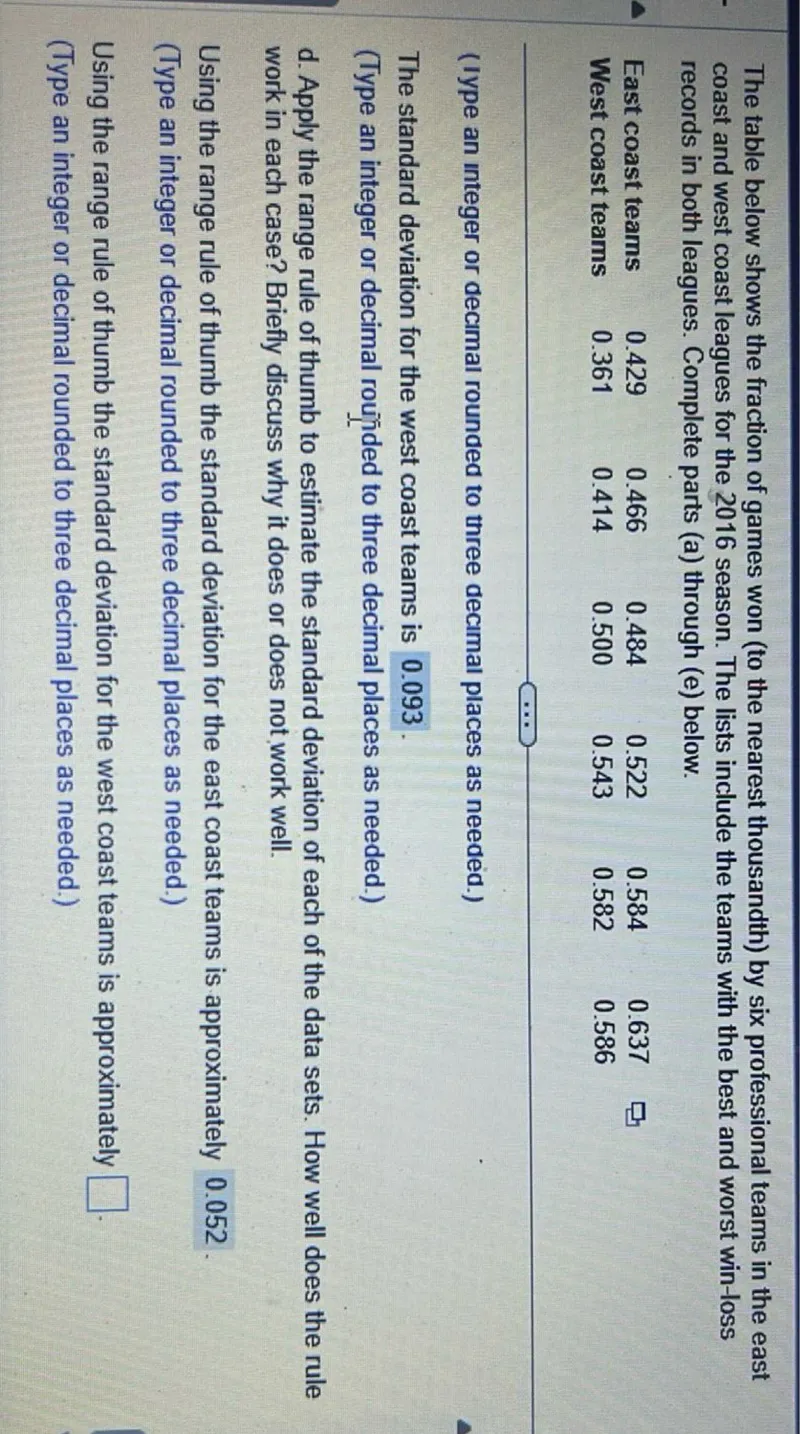
Transcript text: The table below shows the fraction of games won (to the nearest thousandth) by six professional teams in the east coast and west coast leagues for the 2016 season. The lists include the teams with the best and worst win-loss records in both leagues. Complete parts (a) through (e) below. East coast teams & 0.429 & 0.466 & 0.484 & 0.522 & 0.584 & 0.637 \\ West coast teams & 0.361 & 0.414 & 0.500 & 0.543 & 0.582 & 0.586 The standard deviation for the west coast teams is 0.093 . d. Apply the range rule of thumb to estimate the standard deviation of each of the data sets. How well does the rule work in each case? Briefly discuss why it does or does not work well. Using the range rule of thumb the standard deviation for the east coast teams is approximately 0.052 . Using the range rule of thumb the standard deviation for the west coast teams is approximately
failed

Solution

failed
failed

Calculate the standard deviation for the west coast teams using the range rule of thumb.

Understand the range rule of thumb

The range rule of thumb states that the standard deviation can be estimated as: Standard deviation ≈ Range/4

Where the range is the difference between the maximum and minimum values in the dataset.

Identify the maximum and minimum values for west coast teams

From the given data for west coast teams: 0.361, 0.414, 0.500, 0.543, 0.582, 0.586

Maximum value = 0.586 Minimum value = 0.361

Calculate the range

Range = Maximum - Minimum Range = 0.586 - 0.361 = 0.225

Apply the range rule of thumb

Estimated standard deviation = Range/4 Estimated standard deviation = 0.225/4 = 0.056 (rounded to three decimal places)

The standard deviation for the west coast teams using the range rule of thumb is \(\boxed{0.056}\).

The standard deviation for the west coast teams using the range rule of thumb is \(\boxed{0.056}\).

Was this solution helpful?
failed
Unhelpful
failed
Helpful