Find the descriptive statistics for the biology test scores.
Organize the data
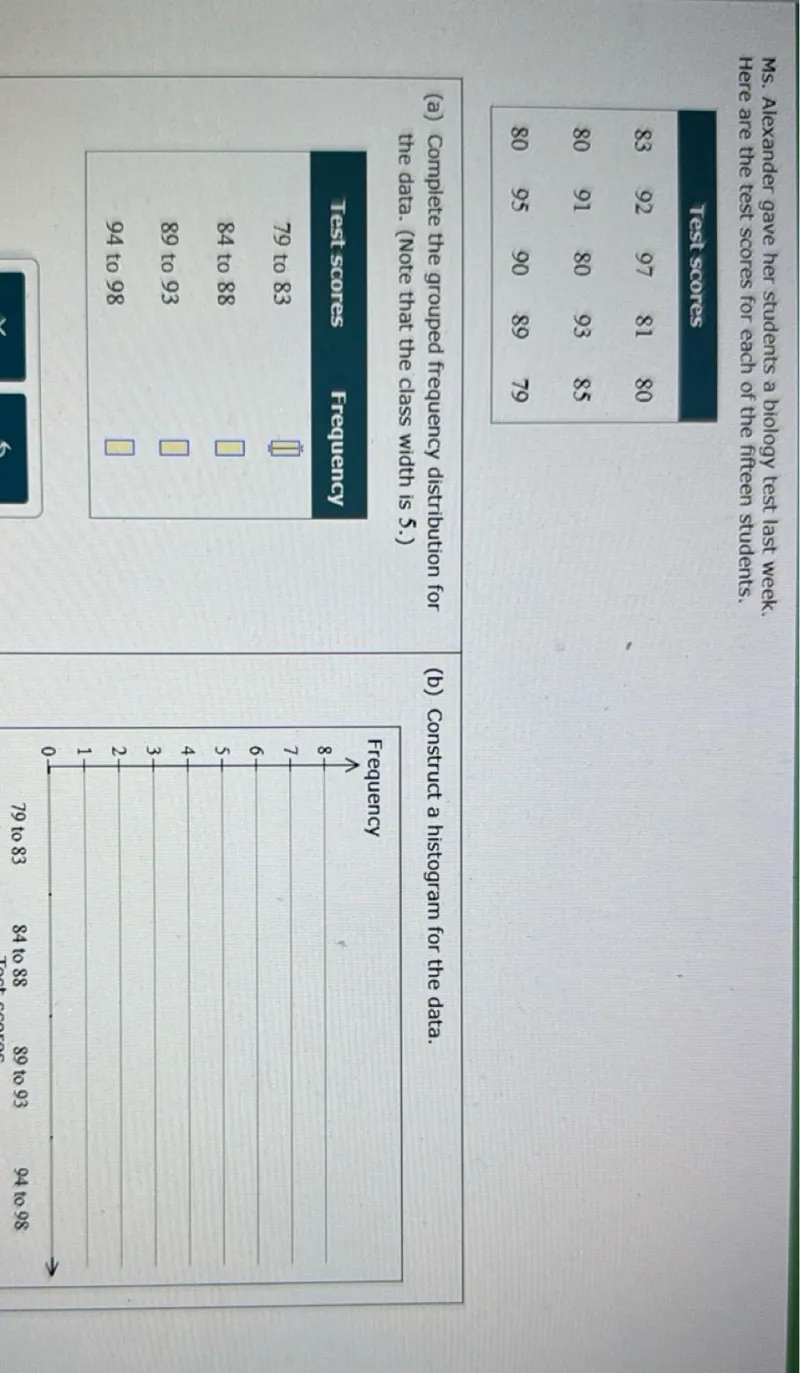
I'll organize the data from the given test scores:
\begin{tabular}{|ccccc|}
\hline \multicolumn{5}{|c|}{ Test scores } \\
83 & 92 & 97 & 81 & 80 \\
80 & 91 & 80 & 93 & 85 \\
80 & 95 & 90 & 89 & 79 \\
\hline
\end{tabular}
The complete list of scores is: 83, 92, 97, 81, 80, 80, 91, 80, 93, 85, 80, 95, 90, 89, 79
Calculate measures of central tendency
Mean:
\(\bar{x} = \frac{83+92+97+81+80+80+91+80+93+85+80+95+90+89+79}{15} = \frac{1295}{15} = 86.33\)
Median: First I'll arrange the data in ascending order:
79, 80, 80, 80, 80, 81, 83, 85, 89, 90, 91, 92, 93, 95, 97
Since there are 15 values (odd number), the median is the 8th value: 85
Mode: The value 80 appears 4 times, which is more frequent than any other value, so the mode is 80.
Calculate measures of dispersion
Range: Maximum - Minimum = 97 - 79 = 18
Variance:
\(s^2 = \frac{\sum(x_i - \bar{x})^2}{n-1}\)
I'll calculate the sum of squared deviations:
\(\sum(x_i - \bar{x})^2 = (83-86.33)^2 + (92-86.33)^2 + ... + (79-86.33)^2\)
Computing this sum gives approximately 642.67
Therefore:
\(s^2 = \frac{642.67}{14} = 45.91\)
Standard Deviation:
\(s = \sqrt{45.91} = 6.77\)
Calculate quartiles
With the ordered data: 79, 80, 80, 80, 80, 81, 83, 85, 89, 90, 91, 92, 93, 95, 97
Q1 (First quartile): The median of the lower half of the data
Lower half: 79, 80, 80, 80, 80, 81, 83
Q1 = 80
Q3 (Third quartile): The median of the upper half of the data
Upper half: 89, 90, 91, 92, 93, 95, 97
Q3 = 92
Interquartile Range (IQR) = Q3 - Q1 = 92 - 80 = 12
\(\boxed{\begin{array}{ll}
\text{Mean} = 86.33 \\
\text{Median} = 85 \\
\text{Mode} = 80 \\
\text{Range} = 18 \\
\text{Standard Deviation} = 6.77 \\
\text{Variance} = 45.91 \\
\text{Q1} = 80 \\
\text{Q3} = 92 \\
\text{IQR} = 12
\end{array}}\)
\(\boxed{\begin{array}{ll}
\text{Mean} = 86.33 \\
\text{Median} = 85 \\
\text{Mode} = 80 \\
\text{Range} = 18 \\
\text{Standard Deviation} = 6.77 \\
\text{Variance} = 45.91 \\
\text{Q1} = 80 \\
\text{Q3} = 92 \\
\text{IQR} = 12
\end{array}}\)