Questions: Solve and graph the following inequality. 0.2 x < -18 Select the correct choice below and fill in the answer box to complete your choice. A. The solution set is x x ≤ 3. B. The solution set is x x ≥ C. The solution set is xx> D. The solution set is x x< Which of the following is the graph of the solution? A. B. C. D.
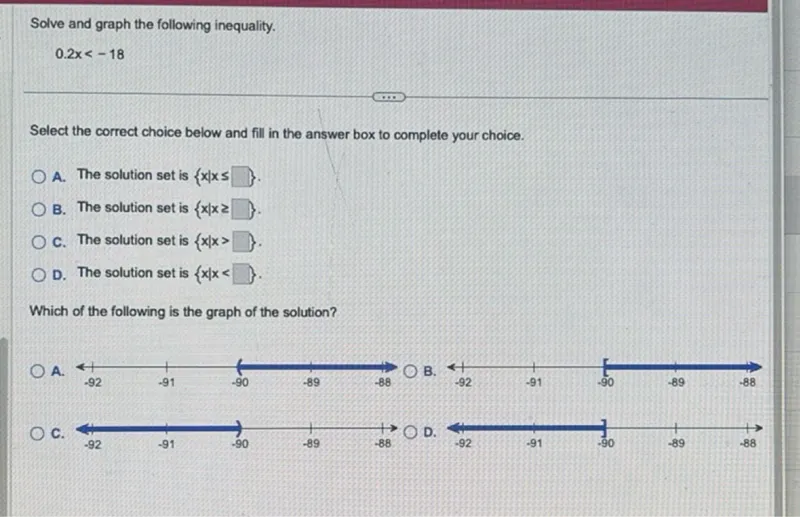
Transcript text: Solve and graph the following inequality.
\[
0.2 x<-18
\]
Select the correct choice below and fill in the answer box to complete your choice.
A. The solution set is $\{x \mid x \leq$ $\square$ 3.
B. The solution set is $\{x \mid x \geq$ $\square$
C. The solution set is $\{x|x\rangle$ $\square$
D. The solution set is $\{x \mid x<$ $\square$ $\}$.
Which of the following is the graph of the solution?
A. B.
c. D.
Solution
Was this solution helpful?


