Questions: The American Association of Individual Investors (AAII) Online Discount Broker Survey polls members on their experiences with discount brokers. As part of the survey, members were asked to rate the quality of the speed of execution with their broker as well as provide an overall satisfaction rating for electronic trades. Possible responses (scores) were no opinion (0), unsatisfied (0), somewhat satisfied (2), satisfied (3), and very satisfied (4). For each broker, summary scores were computed by calculating a weighted average of the scores provided by each respondent. A portion of the survey results follow (AAII website). Develop a scatter diagram for these data with the speed of execution as the independent variable.
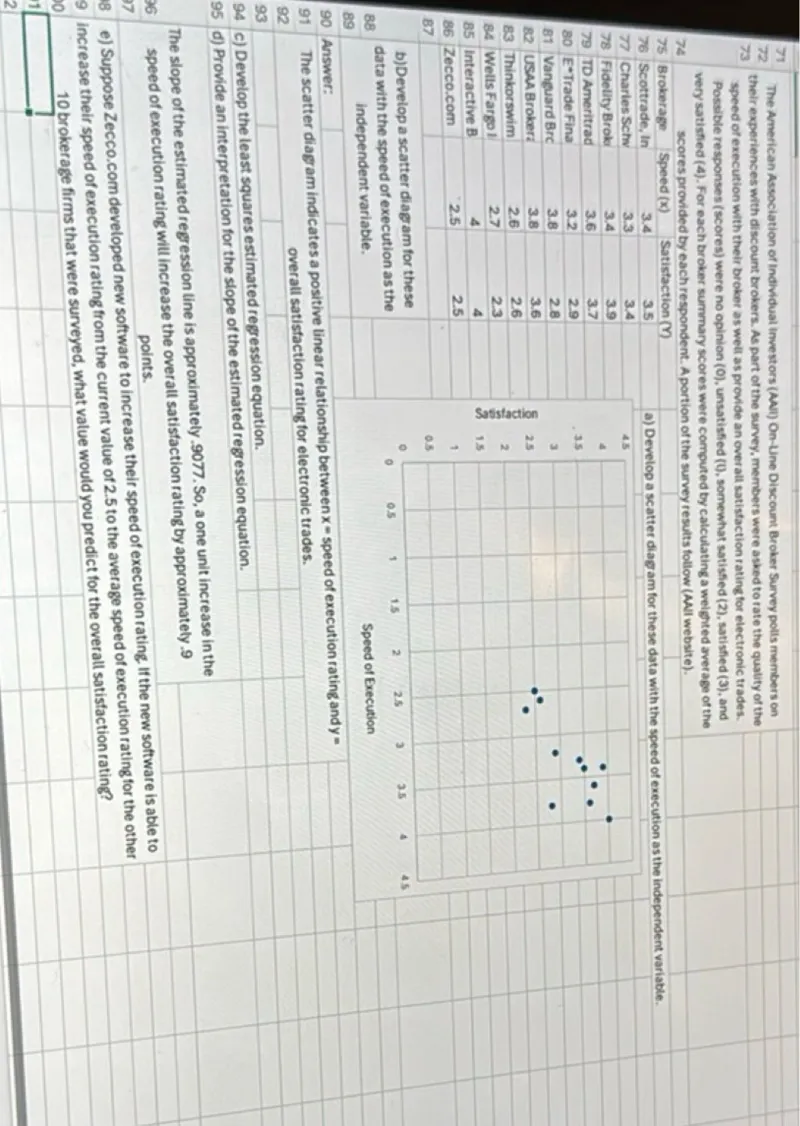
Transcript text: The American Association of Individual Investors (AAII) Online Discount Broker Survey polls members on their experiences with discount brokers. As part of the survey, members were asked to rate the quality of the speed of execution with their broker as well as provide an overall satisfaction rating for electronic trades. Possible responses (scores) were no opinion (0), unsatisfied (0), somewhat satisfied (2), satisfied (3), and very satisfied (4). For each broker, summary scores were computed by calculating a weighted average of the scores provided by each respondent. A portion of the survey results follow (AAII website). Develop a scatter diagram for these data with the speed of execution as the independent variable.
Solution
Was this solution helpful?


