Questions: Each day, for several weeks, a food bank recorded the number of people it served. The box-and-whisker plot summarizes the data. Use the box-and-whisker plot to answer the following. (a) What is the smallest number of people served? (b) What is the median number of people served? (c) What is the third quartile (Q3) of the numbers of people served?
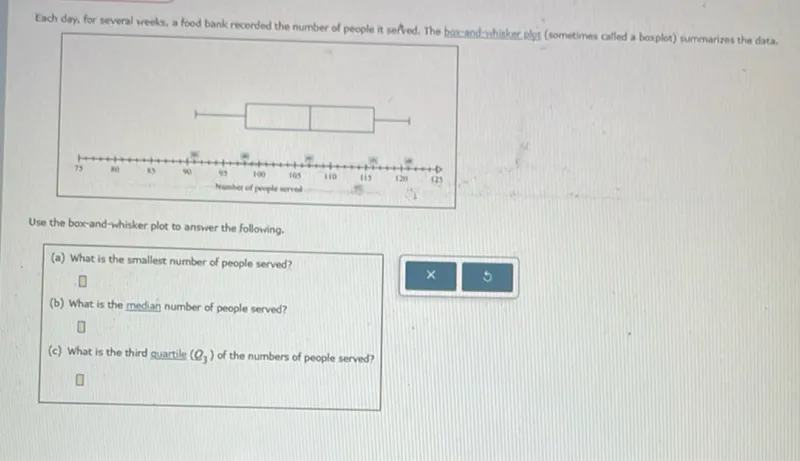
Transcript text: Each day, for several weeks, a food bank recorded the number of people it served. The box-and-whisker plot summarizes the data.
Use the box-and-whisker plot to answer the following.
(a) What is the smallest number of people served?
(b) What is the median number of people served?
(c) What is the third quartile $\left(Q_{3}\right)$ of the numbers of people served?
Solution
Was this solution helpful?


