Questions: A cell phone manufacturer tests the battery lifetimes of its cell phones by recording the time it takes for the battery charges to run out while testers are streaming videos on the phones continuously. The manufacturer claims that the population mean of the battery lifetimes of all phones of their latest model is 5.74 hours. As a researcher for a consumer information service, you want to test that claim. To do so, you select a random sample of 45 cell phones of the manufacturer's latest model and record their battery lifetimes. Assume it is known that the population standard deviation of the battery lifetimes for that cell phone model is 2.42 hours. Based on your sample, follow the steps below to construct a 90% confidence interval for the population mean of the battery lifetimes for all phones of the manufacturer's latest model. Then state whether the confidence interval you construct contradicts the manufacturer's claim. (a) Click on "Take Sample" to see the results from your random sample of 45 phones of the manufacturer's latest model. Number of phones Sample mean Sample standard deviation ------------ ------------- ------------- 45 5.47 2.13 Population standard deviation ------------ 2.42 Enter the values of the sample size, the point estimate for the population mean; the population standard deviation, and the critical value you need for your 90% confidence interval. (Choose the correct critical value from the table of critical values provided.) When you are done, select "Compute". Sample size: Point estimate: Standard error: Population standard deviation: Critical value: Compute (b) Based on your sample, graph the 90% confidence interval for the population mean of the battery lifetimes for all phones of the manufacturer's latest model. - Enter the lower and upper limits on the graph to show your confidence interval. - For the point (4), enter the manufacturer's claim of 5.74 hours.
Transcript text: A cell phone manufacturer tests the battery lifetimes of its cell phones by recording the time it takes for the battery charges to run out while testers are streaming videos on the phones continuously. The manufacturer claims that the population mean of the battery lifetimes of all phones of their latest model is 5.74 hours. As a researcher for a consumer information service, you want to test that claim. To do so, you select a random sample of 45 cell phones of the manufacturer's latest model and record their battery lifetimes. Assume it is known that the population standard deviation of the battery lifetimes for that cell phone model is 2.42 hours.
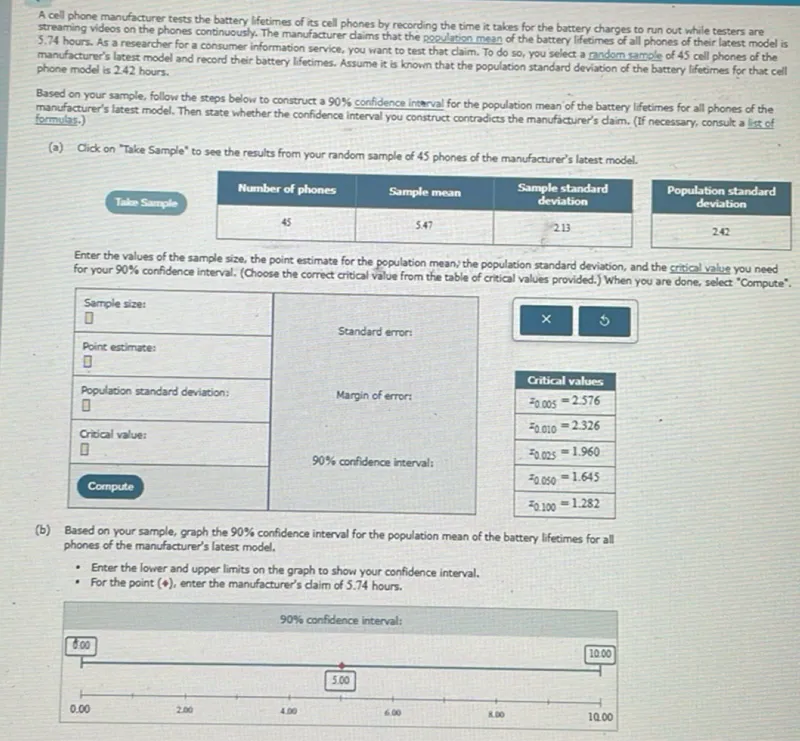
Based on your sample, follow the steps below to construct a $90 \%$ confidence interval for the population mean of the battery lifetimes for all phones of the manufacturer's latest model. Then state whether the confidence interval you construct contradicts the manufacturer's claim.
(a) Click on "Take Sample" to see the results from your random sample of 45 phones of the manufacturer's latest model.
\begin{tabular}{|c|c|c|}
\hline Number of phones & Sample mean & \begin{tabular}{c}
Sample standard \\
deviation
\end{tabular} \\
\hline 45 & 5.47 & 2.13 \\
\hline
\end{tabular}
\begin{tabular}{|c|}
\hline \begin{tabular}{c}
Population standard \\
deviation
\end{tabular} \\
\hline 2.42 \\
\hline
\end{tabular}
Enter the values of the sample size, the point estimate for the population mean; the population standard deviation, and the critical value you need for your $90 \%$ confidence interval. (Choose the correct critical value from the table of critical values provided.) When you are done, select "Compute".
\begin{tabular}{|l|l|}
\hline Sample size: & \\
\hline$\square$ & \\
\hline Point estimate: & \\
\hline$\square$ & Standard error: \\
\hline Population standard deviation: & \\
\hline$\square$ & \\
\hline Critical value: & \\
\hline$\square$ & \\
\hline Compute & \\
\hline
\end{tabular}
(b) Based on your sample, graph the $90 \%$ confidence interval for the population mean of the battery lifetimes for all phones of the manufacturer's latest model.
- Enter the lower and upper limits on the graph to show your confidence interval.
- For the point ( 4 ), enter the manufacturer's claim of 5.74 hours.
Solution
Was this solution helpful?


