Questions: Test: Chapter 1-Appendix-A Question list Question 1 Question 2 Question 3 Question 4 Question 5 Question 6 Question 7 Question 8 The graph shows a relationship between price, x, and quantity demanded, y. Use the graph to answer the question. This function is perfectly inelastic. The slope of this relationship at point A is
Transcript text: Test: Chapter 1-Appendix-A
Question list
Question 1
Question 2
Question 3
Question 4
Question 5
Question 6
Question 7
Question 8
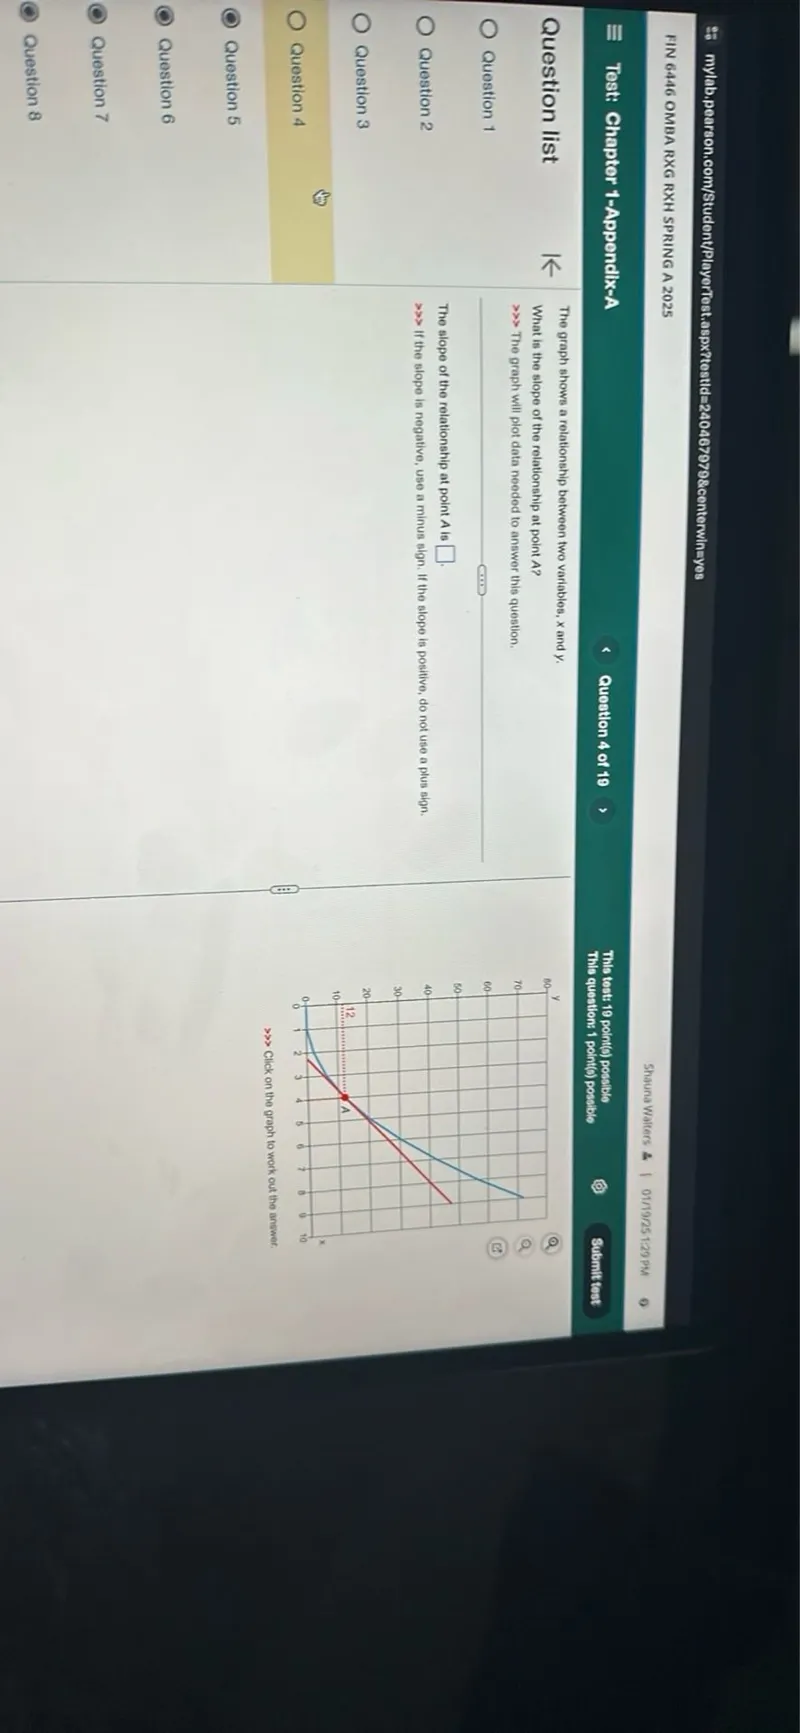
The graph shows a relationship between price, x, and quantity demanded, y. Use the graph to answer the question.
This function is perfectly inelastic.
The slope of this relationship at point A is
Solution
Was this solution helpful?


