Questions: Ten randomly selected cars were filled with either regular or premium gas (the decision was made based on a coin toss) and then driven on the freeway for the entirety of the tank of gas. The next day, each car was filled with whichever type of gas that was not used the previous day and then driven on the freeway for the entirety of the tank of gas. The mileage for each day was recorded and is summarized in the table below. MPG of 10 cars (regular/premium): 13/19, 20/22, 21/24, 23/25, 22/25, 27/26, 25/26, 27/28, 28/32, 22/24. Car 1 Car 2 Car 3 Car 4 Car 5 Car 6 Car 7 Car 8 Car 9 Car 10 Regular 16 20 21 23 22 27 25 27 28 22 Premium 19 22 24 25 25 26 26 28 32 24 You will be constructing a 90% confidence interval estimate of the difference between the mean efficiency of the car using regular and premium gas. You may assume that both samples are drawn from normally distributed populations. Question 1 Construct the 90% confidence interval estimate mean difference between the mileage from cars using regular and premium gas. Round your answer to 2 decimal places. < difference between the means <
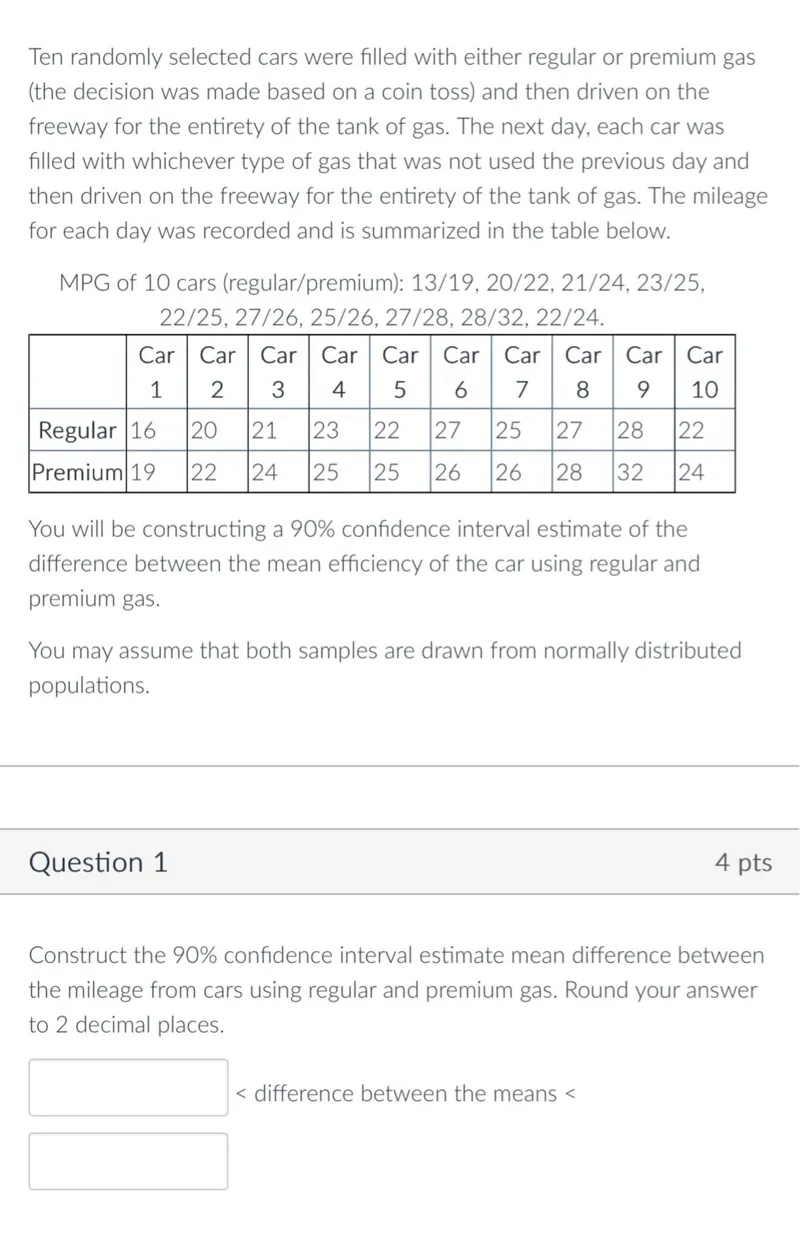
Transcript text: Ten randomly selected cars were filled with either regular or premium gas (the decision was made based on a coin toss) and then driven on the freeway for the entirety of the tank of gas. The next day, each car was filled with whichever type of gas that was not used the previous day and then driven on the freeway for the entirety of the tank of gas. The mileage for each day was recorded and is summarized in the table below.
MPG of 10 cars (regular/premium): 13/19, 20/22, 21/24, 23/25, 22/25, 27/26, 25/26, 27/28, 28/32, 22/24.
\begin{tabular}{|l|c|c|c|c|c|c|c|c|c|c|}
\hline & Car & Car & Car & Car & Car & Car & Car & Car & Car & Car \\
& 1 & 2 & 3 & 4 & 5 & 6 & 7 & 8 & 9 & 10 \\
\hline Regular & 16 & 20 & 21 & 23 & 22 & 27 & 25 & 27 & 28 & 22 \\
\hline Premium & 19 & 22 & 24 & 25 & 25 & 26 & 26 & 28 & 32 & 24 \\
\hline
\end{tabular}
You will be constructing a 90\% confidence interval estimate of the difference between the mean efficiency of the car using regular and premium gas.
You may assume that both samples are drawn from normally distributed populations.
Question 1
4 pts
Construct the $90 \%$ confidence interval estimate mean difference between the mileage from cars using regular and premium gas. Round your answer to 2 decimal places.
$\square$ < difference between the means <
$\square$
Solution
Was this solution helpful?


