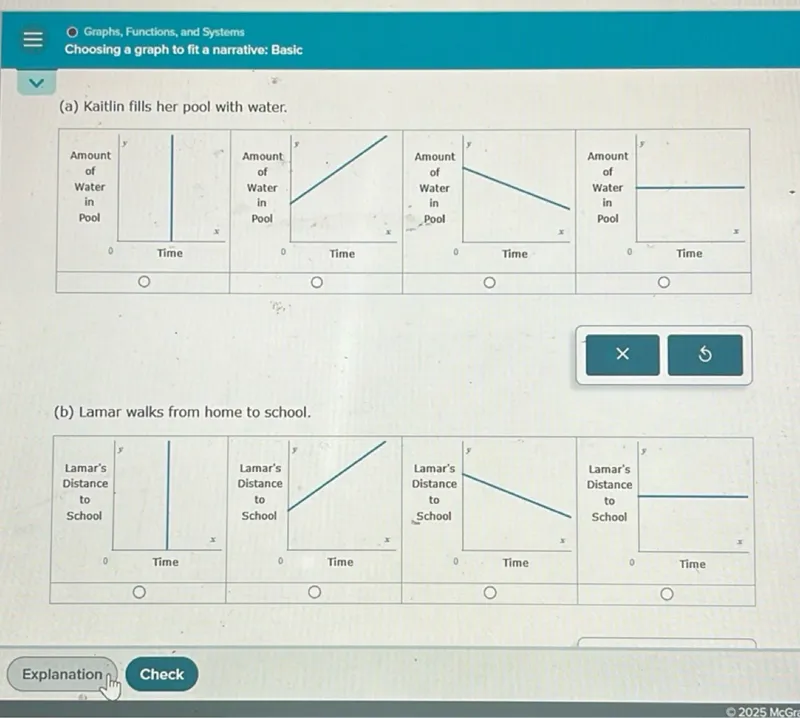
Questions: Graphs, Functions, and Systems
Choosing a graph to fit a narrative: Basic
(a) Kaitlin fills her pool with water.
(b) Lamar walks from home to school.
Transcript text: Graphs, Functions, and Systems
Choosing a graph to fit a narrative: Basic
(a) Kaitlin fills her pool with water.
(b) Lamar walks from home to school.
Solution
Solution Steps
Step 1: Analyze the narrative for Kaitlin filling her pool with water
The narrative describes Kaitlin filling her pool with water. This implies that the water level in the pool increases over time. The graph should show a relationship between time (x-axis) and the water level (y-axis), where the water level increases steadily as time progresses.
Step 2: Determine the type of graph for Kaitlin's scenario
Since the water level increases steadily over time, the graph should be a straight line with a positive slope. This represents a linear function, where the water level rises at a constant rate.
Step 3: Analyze the narrative for Lamar walking from home to school
The narrative describes Lamar walking from home to school. This implies that Lamar's distance from home increases over time until he reaches school. The graph should show a relationship between time (x-axis) and distance from home (y-axis), where the distance increases steadily as time progresses.
Step 4: Determine the type of graph for Lamar's scenario
Since Lamar's distance from home increases steadily over time, the graph should also be a straight line with a positive slope. This represents a linear function, where the distance increases at a constant rate.
Final Answer
For Kaitlin filling her pool with water: \( \boxed{\text{Linear function with positive slope}} \)
For Lamar walking from home to school: \( \boxed{\text{Linear function with positive slope}} \)