Questions: An employment information service claims the mean annual salary for senior level product engineers is 98,000. The annual salaries (in dollars) for a random sample of 16 senior level product engineers are shown in the table to the right. At α=0.01, test the claim that the mean salary is 98,000. Complete parts (a) through (e) below. Assume the population is normally distributed. Annual Salaries 100,688 96,266 93,598 112,656 82,424 74,156 77,072 80,962 102,475 76,179 103,996 103,966 91,106 82,096 85,117 110,231 (Use a comma to separate answers as needed. Round to two decimal places as needed.) Choose the graph which shows the rejection region. (c) Find the standardized test statistic, t. The standardized test statistic is t=-1.88. (Round to two decimal places as needed.) (d) Decide whether to reject or fail to reject the null hypothesis. Fail to reject H0 because the standardized test statistic is not in the rejection region. (e) Interpret the decision in the context of the original claim. There is not enough evidence at the 1% level of significance to reject the claim that the mean annual salary for senior level product engineers is 98,000.
Transcript text: An employment information service claims the mean annual salary for senior level product engineers is $\$ 98,000$. The annual salaries (in dollars) for a random sample of 16 senior level product engineers are shown in the table to the right. At $\alpha=0.01$, test the claim that the mean salary is $\$ 98,000$. Complete parts (a) through (e) below. Assume the population is normally distributed.
\begin{tabular}{|rrrr|}
\hline \multicolumn{4}{|c|}{ Annual Salaries } \\
\hline 100,688 & 96,266 & 93,598 & 112,656 \\
82,424 & 74,156 & 77,072 & 80,962 \\
102,475 & 76,179 & 103,996 & 103,966 \\
91,106 & 82,096 & 85,117 & 110,231 \\
\hline
\end{tabular}
(Use a comma to separate answers as needed. Round to two decimal places as needed.)
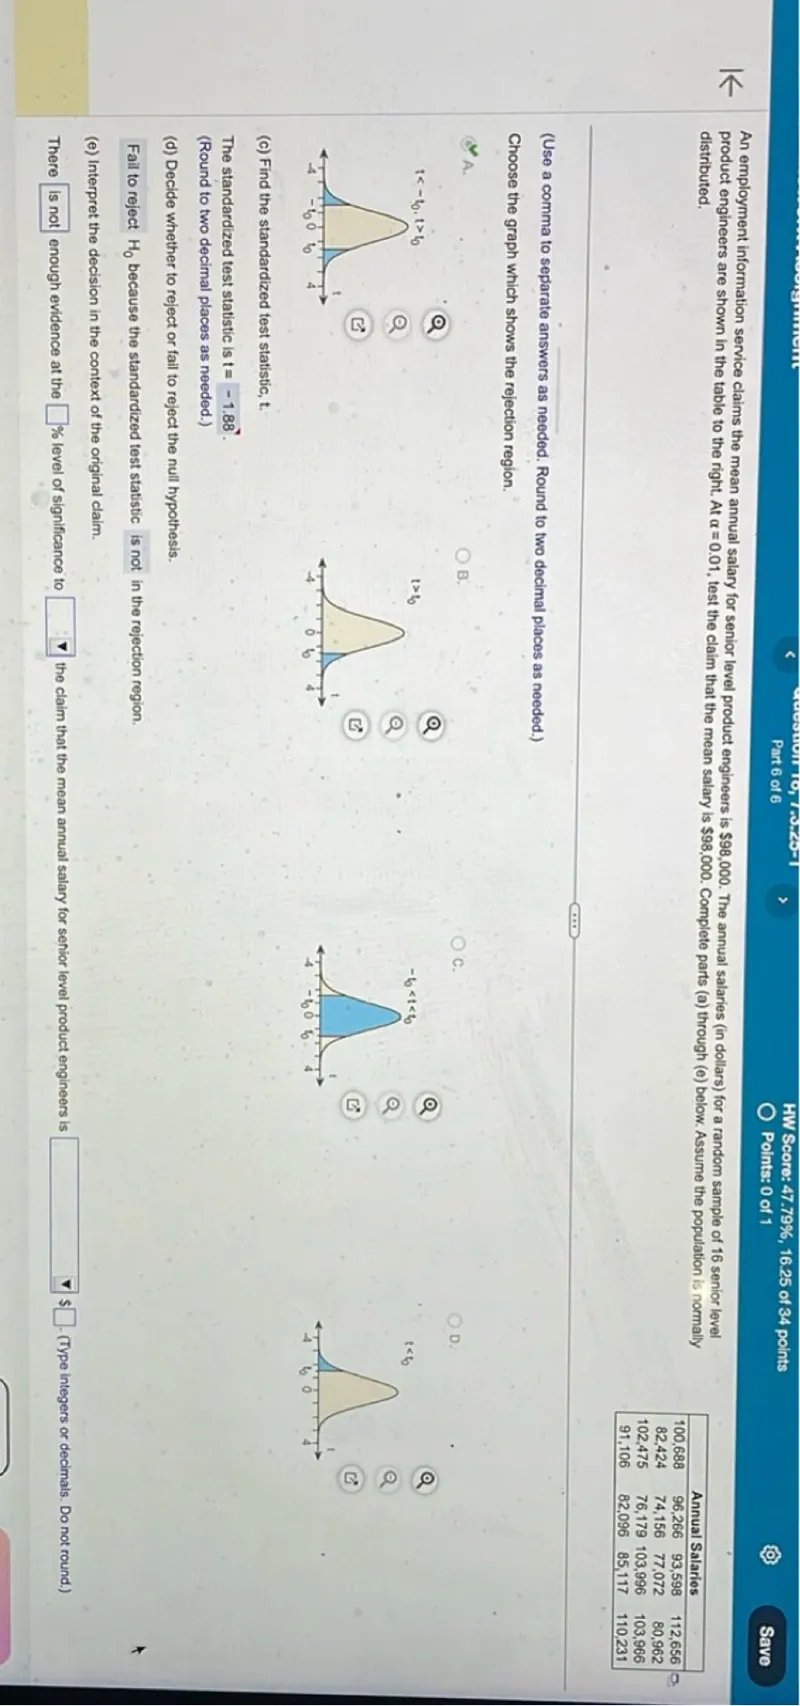
Choose the graph which shows the rejection region.
(c) Find the standardized test statistic, t.
The standardized test statistic is $\mathrm{t}=-1.88$.
(Round to two decimal places as needed.)
(d) Decide whether to reject or fail to reject the null hypothesis.
Fail to reject $H_{0}$ because the standardized test statistic is not in the rejection region.
(e) Interpret the decision in the context of the original claim.
There $\square$ enough evidence at the $\square$ \% level of significance to $\square$ the claim that the mean annual salary for senior level product engineers is $\square$ $\$ \square$
Solution
Was this solution helpful?


