Questions: The graph shown here represents the function f(x). a) Use the graph to evaluate f(-7)= □ b) Use the graph to evaluate f(-3)= □

The graph shown here represents the function f(x).
a) Use the graph to evaluate f(-7)= □
b) Use the graph to evaluate f(-3)= □
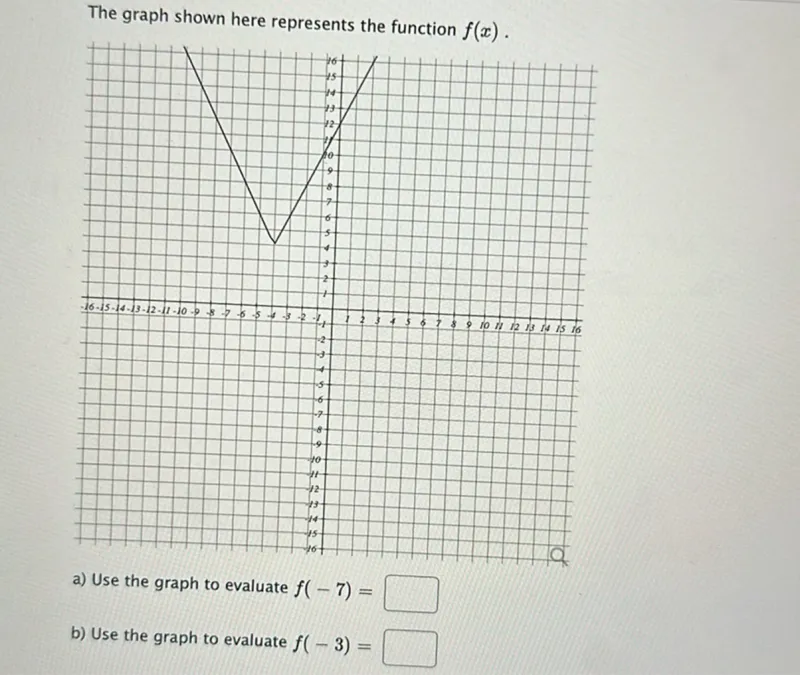
Transcript text: The graph shown here represents the function $f(x)$. a) Use the graph to evaluate $f(-7)=$ $\square$ b) Use the graph to evaluate $f(-3)=$ $\square$
failed

Solution

failed
failed

Solution Steps

Step 1: Evaluate f(-7)

The graph represents the function \(f(x)\). To evaluate \(f(-7)\), we find the value of \(y\) when \(x = -7\). Looking at the graph, when \(x = -7\), \(y = 11\).

Step 2: Evaluate f(-3)

To evaluate \(f(-3)\), we find the value of \(y\) when \(x = -3\). Looking at the graph, when \(x = -3\), \(y = 5\).

Final Answer

a) \(f(-7) = \boxed{11}\) b) \(f(-3) = \boxed{5}\)

Was this solution helpful?
failed
Unhelpful
failed
Helpful