Questions: UNIT 2-CHALLENGE 2: Graphical Representation The frequency table shows the types of homes in which residents were living in 2015. 2015 Housing Data Type of Home Frequency ------ Single-Family Detached 2330 Single-Family Attached 590 Small Apartment Building 1662 Large Apartment Building 1408 Mobile Home 231 Other 179 The relative frequency of residents living in mobile homes in 2015 is Answer choices are rounded to the nearest percentage. a) 36% b) 8% c) 4% d) 23%

UNIT 2-CHALLENGE 2: Graphical Representation

The frequency table shows the types of homes in which residents were living in 2015.

2015 Housing Data

Type of Home  Frequency
------
Single-Family Detached  2330
Single-Family Attached  590
Small Apartment Building  1662
Large Apartment Building  1408
Mobile Home  231
Other  179

The relative frequency of residents living in mobile homes in 2015 is Answer choices are rounded to the nearest percentage.
a) 36%
b) 8%
c) 4%
d) 23%
Transcript text: UNIT 2-CHALLENGE 2:t: Graphical Representation 
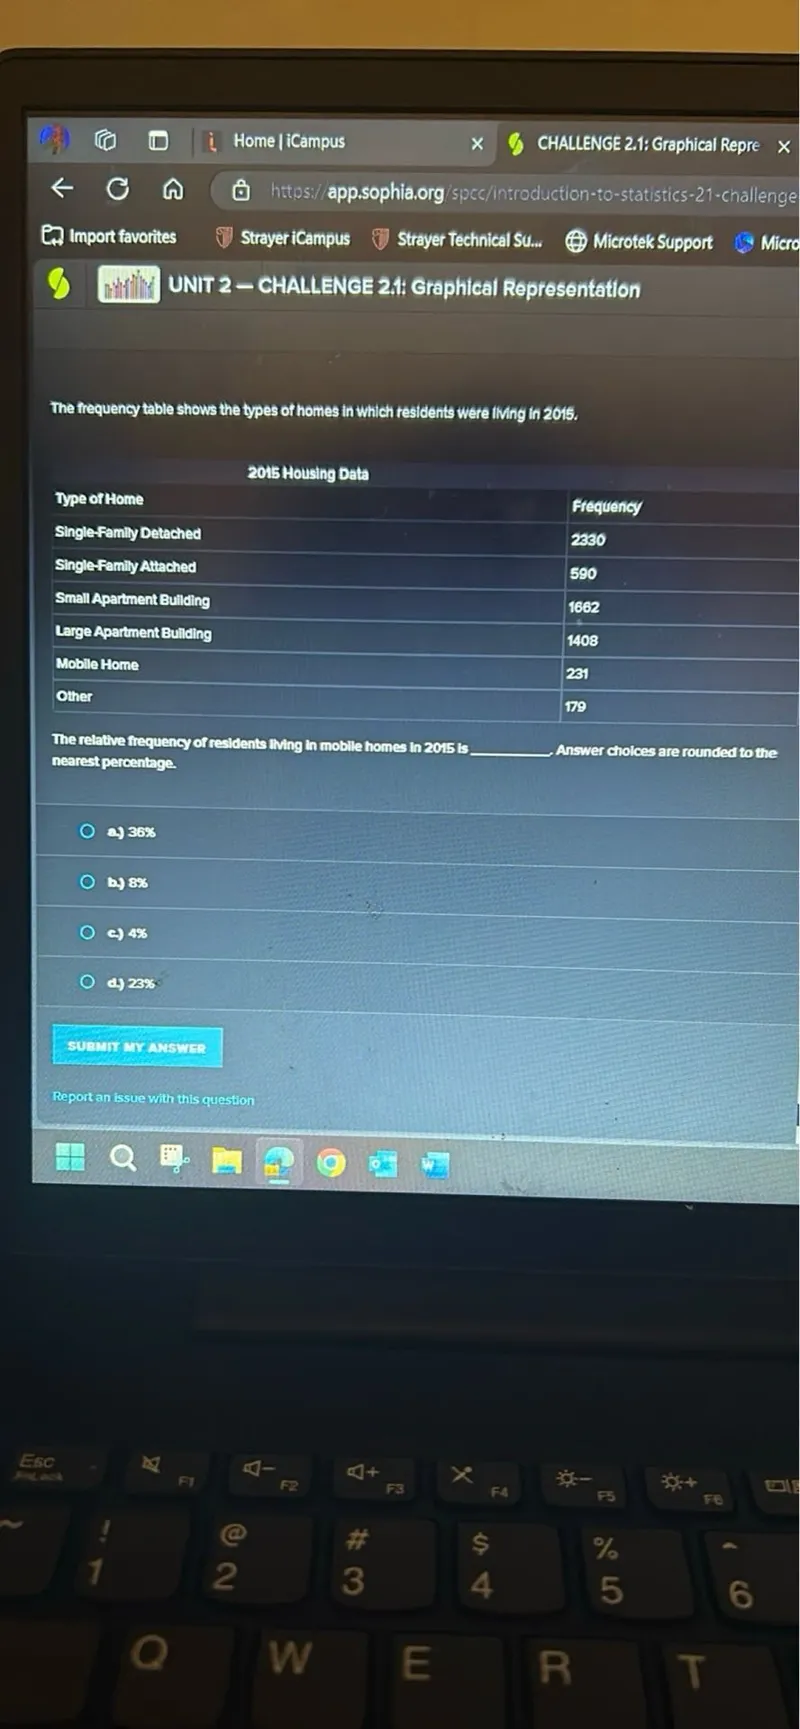
The frequency table shows the types of homes in which residents were iling in 2015. 2015 Housing Data \begin{tabular}{|l|l|} \hline Type ofHome & Frequency \\ \hline Single-Family Detached & 2330 \\ \hline Single-Family Attached & 590 \\ \hline Small Apartment Bullding & 1662 \\ \hline Large Apartment Bullding & 1408 \\ \hline Mobile Home & 231 \\ \hline Other & $\mathbf{1 7 9}$ \\ \hline \end{tabular} The relative frequency of residents 1 ining in mobile homes in 2015 is $\qquad$ Answer choices are rounded to the nearest percentage. a) $36 \%$ b) $8 \%$ c.) $4 \%$ d) $23 \%$
failed

Solution

failed
failed

Solution Steps

Step 1: Calculate the total frequency

To find the relative frequency of residents living in mobile homes, first calculate the total frequency by summing up all the frequencies in the table.

\[ \text{Total Frequency} = 2330 + 590 + 1662 + 1408 + 231 + 179 \]

\[ \text{Total Frequency} = 6400 \]

Step 2: Identify the frequency of mobile homes

From the table, the frequency of residents living in mobile homes is 231.

\[ \text{Frequency of Mobile Homes} = 231 \]

Step 3: Calculate the relative frequency

The relative frequency is calculated by dividing the frequency of mobile homes by the total frequency, then multiplying by 100 to convert it to a percentage.

\[ \text{Relative Frequency} = \left( \frac{231}{6400} \right) \times 100 \]

\[ \text{Relative Frequency} \approx 3.609\% \]

Step 4: Round to the nearest percentage

Round the relative frequency to the nearest whole number.

\[ \text{Rounded Relative Frequency} \approx 4\% \]

Final Answer

\(\boxed{4\%}\)

Was this solution helpful?
failed
Unhelpful
failed
Helpful