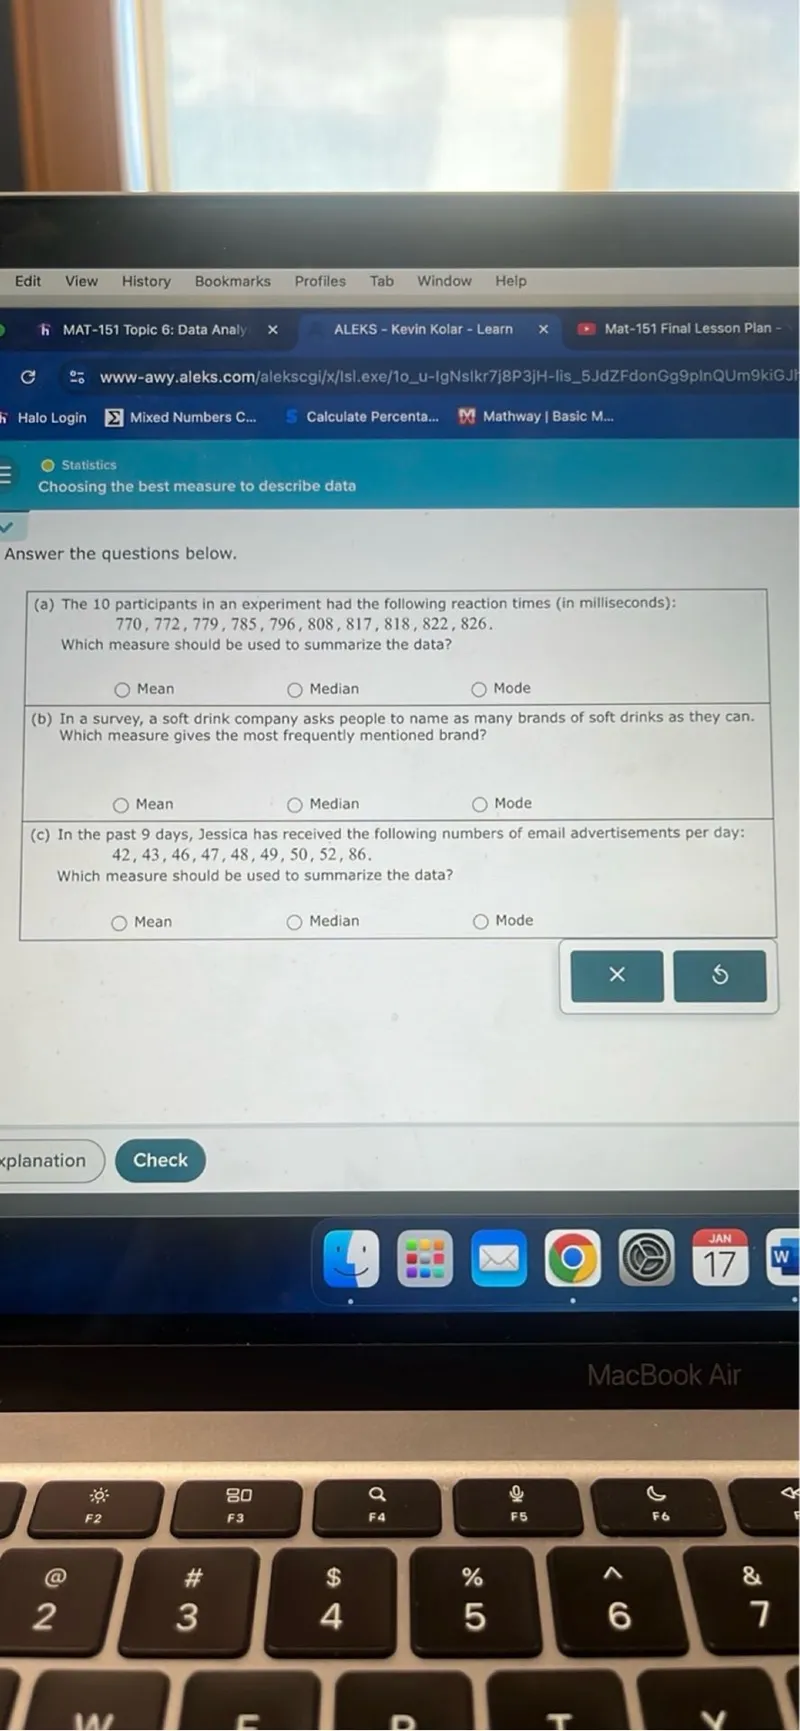
Questions: Choosing the best measure to describe data Answer the questions below. (a) The 10 participants in an experiment had the following reaction times (in milliseconds): 770,772,779,785,796,808,817,818,822,826 Which measure should be used to summarize the data? Mean Median Mode (b) In a survey, a soft drink company asks people to name as many brands of soft drinks as they can. Which measure gives the most frequently mentioned brand? Mean Median Mode (c) In the past 9 days, Jessica has received the following numbers of email advertisements per day: 42,43,46,47,48,49,50,52,86 Which measure should be used to summarize the data? Mean Median Mode

Transcript text: Choosing the best measure to describe data
Answer the questions below.
(a) The 10 participants in an experiment had the following reaction times (in milliseconds):
\[
770,772,779,785,796,808,817,818,822,826
\]
Which measure should be used to summarize the data?
Mean Median Mode
(b) In a survey, a soft drink company asks people to name as many brands of soft drinks as they can. Which measure gives the most frequently mentioned brand?
Mean Median Mode
(c) In the past 9 days, Jessica has received the following numbers of email advertisements per day:
\[
42,43,46,47,48,49,50,52,86
\]
Which measure should be used to summarize the data?
Mean Median Mode


