Questions: Determine the interval where the function f(x), shown below, is decreasing. Move the black points to the appropriate x-coordinates to define the interval. Notice that the movable points are labeled the "Left" or "Right" endpoint of the interval. If the interval's endpoint is +∞ or -∞, then move the corresponding endpoint to the very edge of the graph.

Determine the interval where the function f(x), shown below, is decreasing. Move the black points to the appropriate x-coordinates to define the interval. Notice that the movable points are labeled the "Left" or "Right" endpoint of the interval. If the interval's endpoint is +∞ or -∞, then move the corresponding endpoint to the very edge of the graph.
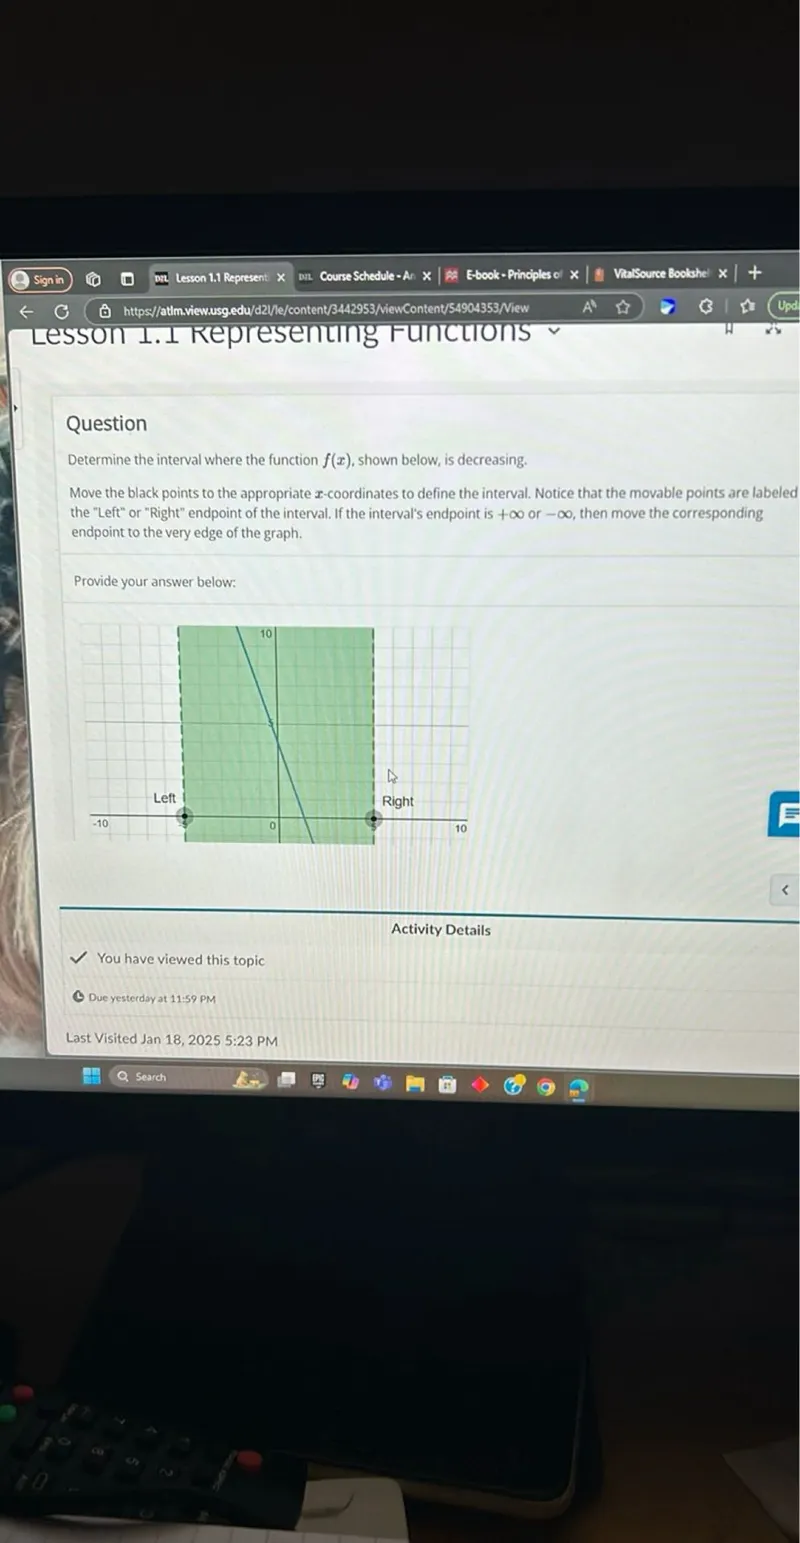
Transcript text: Determine the interval where the function $f(x)$, shown below, is decreasing. Move the black points to the appropriate $\boldsymbol{x}$-coordinates to define the interval. Notice that the movable points are labeled the "Left" or "Right" endpoint of the interval. If the interval's endpoint is $+\infty$ or $-\infty$, then move the corresponding endpoint to the very edge of the graph.
failed

Solution

failed
failed

Solution Steps

Step 1: Identify the decreasing portion of the graph

A function is decreasing where the graph goes downwards from left to right. In the given graph, the function is decreasing in the shaded green region.

Step 2: Determine the left bound

The shaded region begins at approximately $x = -5$. This corresponds to the "Left" point on the graph.

Step 3: Determine the right bound

The shaded region appears to extend indefinitely to the right. This means the right bound is positive infinity. The "Right" point should be moved to the very edge of the graph on the right side.

Final Answer

\\( \boxed{(-5, \infty)} \\)

Was this solution helpful?
failed
Unhelpful
failed
Helpful