Questions: This double bar graph shows day lengths for two cities, Blueville and Red City. Which two statements are most useful in explaining the data for both cities? Select the two correct answers. Earth moves slightly closer and farther away from the sun during its orbit. The moon completes one orbit around Earth every month. Earth rotates on a tilted axis. Earth's atmosphere can make the sun appear either larger or smaller. Earth completes one orbit around the sun every year. Average Hours of Daylight for Two Cities

This double bar graph shows day lengths for two cities, Blueville and Red City.

Which two statements are most useful in explaining the data for both cities?

Select the two correct answers.

Earth moves slightly closer and farther away from the sun during its orbit.

The moon completes one orbit around Earth every month.
Earth rotates on a tilted axis.

Earth's atmosphere can make the sun appear either larger or smaller.
Earth completes one orbit around the sun every year.

Average Hours of Daylight for Two Cities
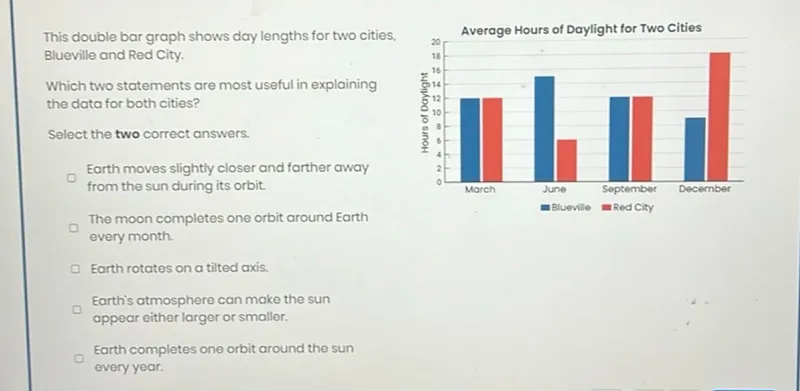
Transcript text: This double bar graph shows day lengths for two cities, Blueville and Red City. Which two statements are most useful in explaining the data for both cities? Select the two correct answers. Earth moves slightly closer and farther away from the sun during its orbit. The moon completes one orbit around Earth every month. Earth rotates on a tilted axis. Earth's atmosphere can make the sun appear either larger or smaller. Earth completes one orbit around the sun every year. Average Hours of Daylight for Two Cities
failed

Solution

failed
failed

This double bar graph shows day lengths for two cities, Blueville and Red City. Which two statements are most useful in explaining the data for both cities? Understanding the graph The graph shows the average hours of daylight for Blueville and Red City across four months: March, June, September, and December. Both cities show a variation in daylight hours throughout these months. Analyzing the options Option 1: Earth moves slightly closer and farther away from the sun during its orbit. This slightly affects the intensity of sunlight received but doesn't significantly impact the length of daylight hours. Option 2: The moon completes one orbit around Earth every month. The moon's orbit primarily influences tides and does not explain the seasonal variations in daylight. Option 3: Earth rotates on a tilted axis. This is the primary reason for seasons and the variation in daylight hours throughout the year. The tilt causes different parts of the Earth to receive more direct sunlight during different times of the year. Option 4: Earth's atmosphere can make the sun appear either larger or smaller. Atmospheric conditions can affect visibility and the perceived size of the sun, but don't alter the actual length of daylight. Option 5: Earth completes one orbit around the sun every year. This yearly cycle, combined with Earth's tilted axis, creates the seasons and thus the variations in day length depicted in the graph.

\( \boxed{\text{Earth rotates on a tilted axis.} \\ \text{Earth completes one orbit around the sun every year.}} \)

Earth rotates on a tilted axis. Earth completes one orbit around the sun every year.

Was this solution helpful?
failed
Unhelpful
failed
Helpful